. 2012 Jan 1;63(1):19-34.
doi: 10.1016/j.jeem.2011.07.004.

Climate change, humidity, and mortality in the United States

Affiliations

Climate change, humidity, and mortality in the United States

Alan I Barreca. J Environ Econ Manage. .

Abstract

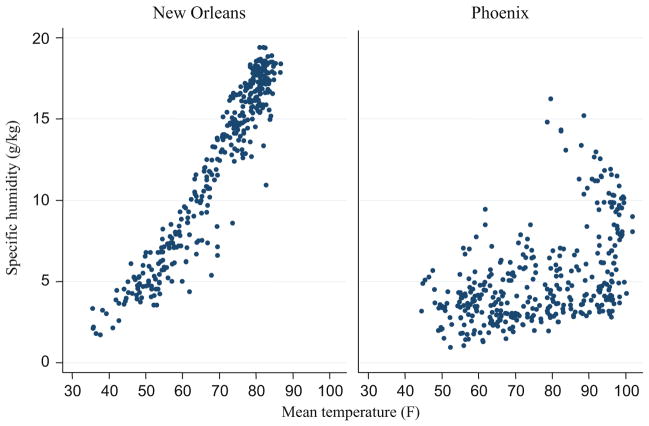
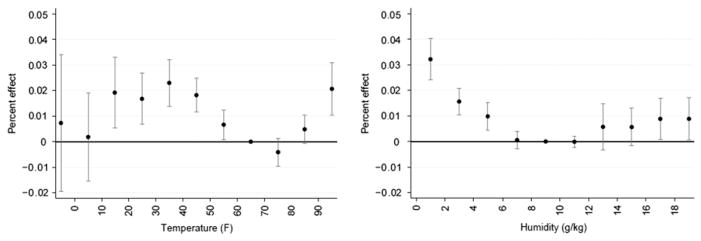
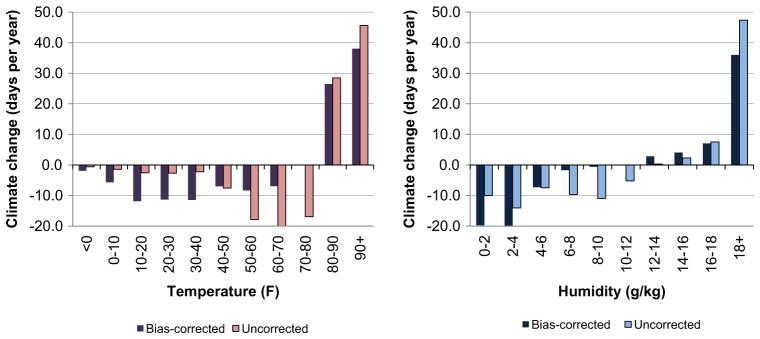
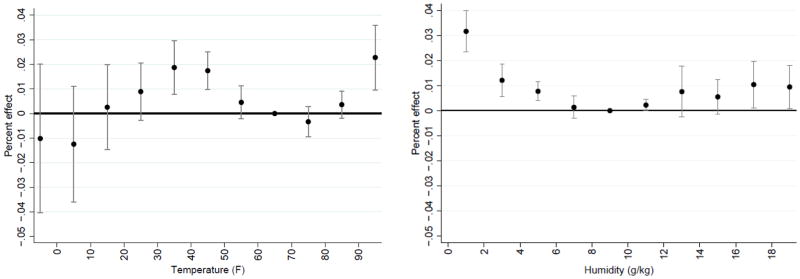
This paper estimates the effects of humidity and temperature on mortality rates in the United States (c. 1973-2002) in order to provide an insight into the potential health impacts of climate change. I find that humidity, like temperature, is an important determinant of mortality. Coupled with Hadley CM3 climate-change predictions, I project that mortality rates are likely to change little on the aggregate for the United States. However, distributional impacts matter: mortality rates are likely to decline in cold and dry areas, but increase in hot and humid areas. Further, accounting for humidity has important implications for evaluating these distributional effects.

Keywords: Climate change; Humidity; Mortality; Temperature.


Figures

Fig. 1
Fig. 1
Daily mean temperature (°F) and daily mean specific humidity (g/kg), New Orleans and Phoenix, by day, 2002 only.
Fig. 2
Fig. 2
Main results, the percentage change in the annual mortality rate from one additional day within a given temperature or humidity bin relative to 60–70 °F and 8 – 10 g/kg, respectively. Notes: Regression coefficients from Table 1, column (3), are normalized based on the average mortality rate (per 100,000) for the 373 counties in my sample. The dots represent the point estimates and the brackets represent the 95% confidence interval.
Fig. 3
Fig. 3
By primary cause of death, the percentage change in the annual mortality rate from one additional day within a given temperature or humidity bin relative to 60–70°F and 8 – 10 g/kg, respectively. Panel A: Primary cause is cardiovasular and Panel B: Primary cause is cancer. Notes: See the notes to Fig. 2. Axes vary across Panel A and Panel B.
Fig. 4
Fig. 4
For influenza-related fatalities, the percentage change in the annual mortality rate from one additional day within a given temperature or humidity bin relative to 60–70°F and 8 – 10 g/kg, respectively. Notes: See the notes to Fig. 2. The standard errors on the coefficient for temperatures below 0 °F and between 10 and 20 °F are too large to be illustrated here. Influenza-related fatalities are defined as any death where influenza is listed as a primary or secondary cause of death.
Fig. 5
Fig. 5
The percentage change in annual per capita energy consumption in the residential sector from one additional day within a given temperature or humidity bin relative to 60–70 °F and 8 – 10 g/kg, respectively. Notes: See notes to Fig. 2. Regression estimates were normalized based on average energy consumption over the 1973–2002 period.
Fig. 6
Fig. 6
Climatic changes (in days per year) between the 1973–2002 period and the 2070–2099 period, A1F1 scenario of the Hadley CM3 climate-change model. Notes: The bias-corrected predictions adjust for differences between the Hadley CM3 model data and the GSOD weather data between 1990 and 2002. The predicted climatic changes only pertain to the 373 counties in my core sample.
Appendix Figure 1
Appendix Figure 1
The percentage change in the annual mortality rate from one additional day within a given temperature or humidity bin, three-month moving average Notes: See the notes to Figure II. This model uses the specification in Table 2 column (3). However, the construction of the explanatory weather variables involves a three-month moving average.
Appendix Figure 2
Appendix Figure 2
The percentage change in the annual mortality rate from one additional day at given temperature or humidity level relative to 65°F or 9 g/kg, respectively, 5th-degree cubic spline Notes: Solid line represents estimated effect size. The dash line represents the 95 percent confidence interval. This model uses a 5th degree polynomial spline in place of the semi-parametric bins.
Appendix Figure 3
Appendix Figure 3
Mortality estimates broken out by hot and cold counties Panel B: The top 50 percent coldest counties Notes: See the notes to Figure II. The counties are broken into two mutually exclusive samples based on the fraction of the year with temperatures above 65°F. The standard errors on temperatures below 10°F (Panel A) and temperature above 90°F (Panel B) are too large to be displayed here.
Appendix Figure 3
Appendix Figure 3
Mortality estimates broken out by hot and cold counties Panel B: The top 50 percent coldest counties Notes: See the notes to Figure II. The counties are broken into two mutually exclusive samples based on the fraction of the year with temperatures above 65°F. The standard errors on temperatures below 10°F (Panel A) and temperature above 90°F (Panel B) are too large to be displayed here.
Appendix Figure 4
Appendix Figure 4
Mortality estimates using a state-month model Notes: See the notes to Figure II. The state-month model includes state-by-calendar-month quadratic time trends, state fixed effects, and unrestricted year-month fixed effects.

References

    1. Deschênes Olivier, Greenstone Michael DG. Working Paper no. 13178. June. NBER; Cambridge, MA: 2007. Climate Change, Mortality and Adaptation: Evidence from Annual Fluctuations in Weather in the United States.
    1. Gaffen Dian J, Ross Rebecca J. Climatology and trends of United States surface humidity and temperature. Journal of Climate. 1999;12:811–828.
    1. Willett Katherine M, Gillett Nathan P, Jones Philip D, Thorne Peter W. Attribution of observed surface humidity changes to human influence. Nature. 2007;449:710–713. - PubMed
    1. Allali Abdelkader, Bojariu Roxana, Diaz Sandra, Elgizouli Ismail, Griggs Dave, Hawkins David, Hohmeyer Olav, editors. International Panel on Climate Change (IPCC) Climate Change 2007: Synthesis Report. Cambridge University Press; Cambridge, UK and New York, NY, USA: 2007.
    1. Schwartz Joel, Samet Jonathan M, Patz Jonathan A. Hospital admissions for heart disease. the effects of temperature and humidity. Epidemiology. 2004;15:755–761. - PubMed

LinkOut - more resources