. 2014 Sep;4(5):721-37.
doi: 10.1002/brb3.252. Epub 2014 Jul 28.

Structural covariance of superficial white matter in mild Alzheimer's disease compared to normal aging

Affiliations

Structural covariance of superficial white matter in mild Alzheimer's disease compared to normal aging

Cristian Carmeli et al. Brain Behav. 2014 Sep.

Abstract

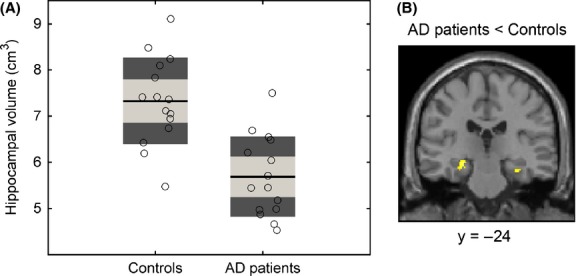
Introduction: Interindividual variations in regional structural properties covary across the brain, thus forming networks that change as a result of aging and accompanying neurological conditions. The alterations of superficial white matter (SWM) in Alzheimer's disease (AD) are of special interest, since they follow the AD-specific pattern characterized by the strongest neurodegeneration of the medial temporal lobe and association cortices.

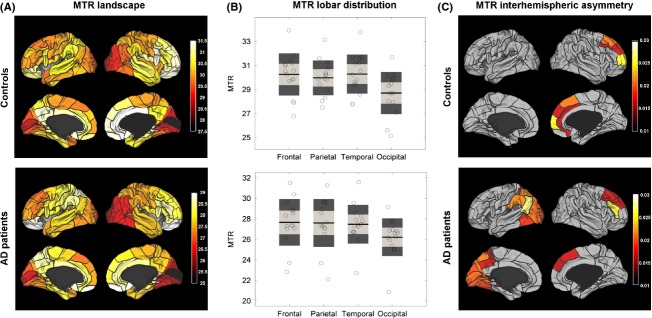
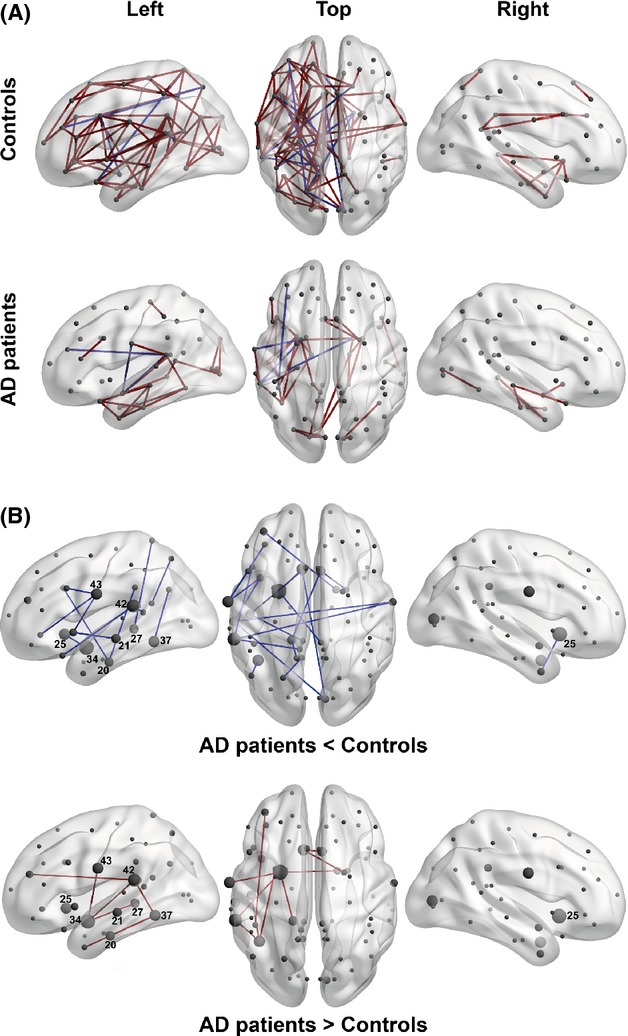
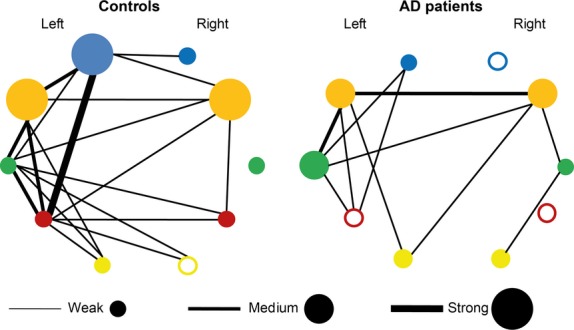
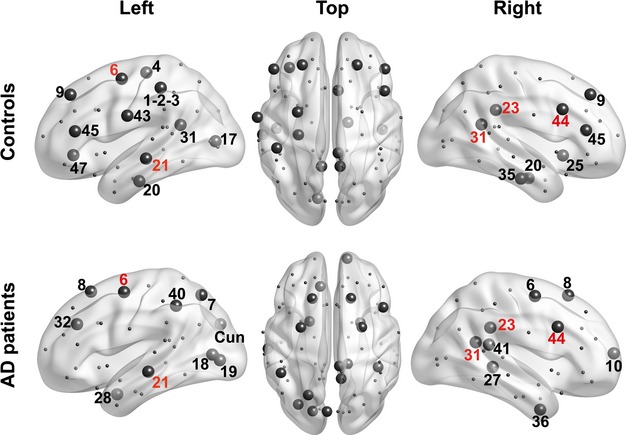
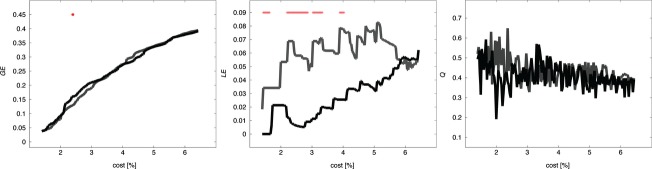
Methods: Here, we present an SWM network analysis in comparison with SWM topography based on the myelin content quantified with magnetization transfer ratio (MTR) for 39 areas in each hemisphere in 15 AD patients and 15 controls. The networks are represented by graphs, in which nodes correspond to the areas, and edges denote statistical associations between them.

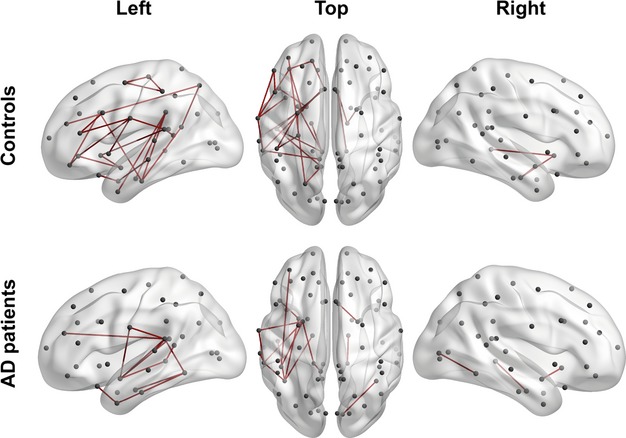
Results: In both groups, the networks were characterized by asymmetrically distributed edges (predominantly in the left hemisphere). The AD-related differences were also leftward. The edges lost due to AD tended to connect nodes in the temporal lobe to other lobes or nodes within or between the latter lobes. The newly gained edges were mostly confined to the temporal and paralimbic regions, which manifest demyelination of SWM already in mild AD.

Conclusion: This pattern suggests that the AD pathological process coordinates SWM demyelination in the temporal and paralimbic regions, but not elsewhere. A comparison of the MTR maps with MTR-based networks shows that although, in general, the changes in network architecture in AD recapitulate the topography of (de)myelination, some aspects of structural covariance (including the interhemispheric asymmetry of networks) have no immediate reflection in the myelination pattern.

Keywords: Connectivity; U-fibers; graph theory; interhemispheric asymmetry; magnetization transfer imaging.


Figures

Figure 1
Figure 1
Hippocampal volume in AD patients and control subjects. (A) The total (left hemisphere + right hemisphere) volume of the hippocampus is shown for the control and AD groups. For each group, the estimated individual values are shown with empty black-bordered circles. The black lines represent the group mean, the light gray boxes represent the interval spanned by the mean ± 1 SD, and the dark gray boxes the mean ± 1.96 SD. The between-group contrast (AD < Controls) is significant at P < 0.001 (GLM with total intracranial volume, age, and gender as covariates). (B) The coronal slice (y = −24) shows the clusters of voxels (yellow) in the hippocampi where we found a loss of gray matter volume in the AD group (P < 0.05, cluster level FWE-corrected). For presentation purposes, the SPM is overlaid on the T1-weighted image of the population average (an output of the DARTEL algorithm) translated into the MNI space.
Figure 2
Figure 2
Landscapes of myelination of superficial white matter in elderly controls and AD patients. (A) The mean areal MTR values are shown with 3D rendering in the lateral and medial views of the two hemispheres. The color-bars represent the raw MTR values, gray represents regions where BA are not defined. Rendering and display of the maps have been obtained with Caret software (http://www.nitrc.org/projects/caret/). (B) The lobar MTR values (left hemisphere + right hemisphere) are shown for controls (top) and AD patients (bottom). For each group, the individual values are shown with empty black-bordered circles. The black lines represent the group mean, the light gray boxes the mean ± 1 SD, and the dark gray boxes the mean ± 1.96 SD. (C) The interhemispheric asymmetry of MTR values is color-coded in controls (top) and AD patients (bottom) according to the value of laterality index. Note that for presentation purposes, we show only regions with a nonzero laterality index (P < 0.05, uncorrected). Gray regions refer to insignificant interhemispheric differences in MTR values (P > 0.05, uncorrected). Both controls and AD patients demonstrate a rightward asymmetry in the prefrontal regions. The parietal and occipital ROIs show an asymmetry of SWM only in the AD group.
Figure 3
Figure 3
The MTR-based covariance networks in controls and AD patients. (A) The networks are rendered on the 3D smoothed brain of the ICBM152 template with the BrainNet Viewer (http://www.nitrc.org/projects/bnv/). They are presented in the left lateral, top, and the right lateral views of the brain for controls (top row) and AD patients (bottom row). Nodes are designated as gray circles located at the centers of mass of each ROI. Significant edges (lfdr < 0.2) are drawn in red for positive partial correlations and in blue for negative partial correlations. (B) The edges significantly different between elderly controls and AD patients (lfdr < 0.2) are rendered as in Fig. 3A. A node size corresponds to the degree of difference (i.e., to the number of edges significantly different in the AD compared to the control group). The nodes labeled with the associated Brodmann area number in white have degrees larger than two. The blue edges are present in controls, but not in AD patients (top row), while the red edges are present in AD patients, but not in controls (bottom row).
Figure 4
Figure 4
Interhemispheric network asymmetry in elderly controls and AD patients. The edges significantly different (lfdr < 0.2) between the left (LH) and right (RH) hemispheres are rendered as in Fig. 2. The edges are drawn in the LH, if corresponding partial correlation values are higher in the LH, and in the RH, if the opposite is true.
Figure 5
Figure 5
Macro-networks in elderly subjects and AD patients. The networks including the frontal (blue), paralimbic (orange), temporal (green), parietal (purple), and occipital (yellow) regions are drawn for controls and AD patients. Nodes represent intraregional connectivity (correlation). The empty nodes stand for insignificant intraregional correlation, while colored nodes correspond to significant intraregional correlations. In so doing, the radius of a colored node corresponds to an intracorrelation level (weak, medium, or strong). Edges represent interregional connectivity (correlations) and their thickness matches one of the three levels described for the nodes.
Figure 6
Figure 6
Network hubs in AD and control subjects. Hubs in control and AD subjects (top and bottom row, respectively) are drawn as large circles. They correspond to the nodes with an integrated node degree value lying in the upper quartile of the distribution. The numbers denote the Brodmann areas where corresponding nodes are located. Hubs common to the control and AD subjects are designated with red numbers, while group-specific hubs are designated with black numbers.
Figure 7
Figure 7
Network topology in AD and control subjects. The curves show the global efficiency GE (left panel), local efficiency LE (middle panel), and modularity index Q (right panel) as a function of density (percentage of nonnull edges) in AD patients (black) and controls (gray). Red stars show cost values, for which there is a significant difference between the AD and the control groups (P < 0.05, uncorrected for multiple comparisons).

References

    1. Achard S, Bullmore E. Efficiency and cost of economical brain functional networks. PLoS Comput. Biol. 2007;3:174–183. - PMC - PubMed
    1. Agosta F, Pievani M, Sala S, Geroldi C, Galluzzi S, Frisoni GB, et al. White matter damage in Alzheimer disease and its relationship to gray matter atrophy. Radiology. 2011;258:853–863. - PubMed
    1. Alexander-Bloch A, Giedd JN, Bullmore E. Imaging structural co-variance between human brain regions. Nat. Rev. Neurosci. 2013a;14:322–336. - PMC - PubMed
    1. Alexander-Bloch AF, Raznahan A, Giedd J, Bullmore ET. The convergence of maturational change and structural covariance in human cortical networks. J. Neurosci. 2013b;33:2889–2899. - PMC - PubMed
    1. Armstrong CL, Traipe E, Hunter JV, Haselgrove JC, Ledakis GE, Tallent EM, et al. Age-related, regional, hemispheric, and medial-lateral differences in myelin integrity in vivo in the normal adult brain. AJNR Am. J. Neuroradiol. 2004;25:977–984. - PMC - PubMed

Publication types

LinkOut - more resources