. 2014 Oct 16;9(10):e110381.
doi: 10.1371/journal.pone.0110381. eCollection 2014.

Hydrophobicity and aromaticity are primary factors shaping variation in amino acid usage of chicken proteome

Affiliations

Hydrophobicity and aromaticity are primary factors shaping variation in amino acid usage of chicken proteome

Yousheng Rao et al. PLoS One. .

Abstract

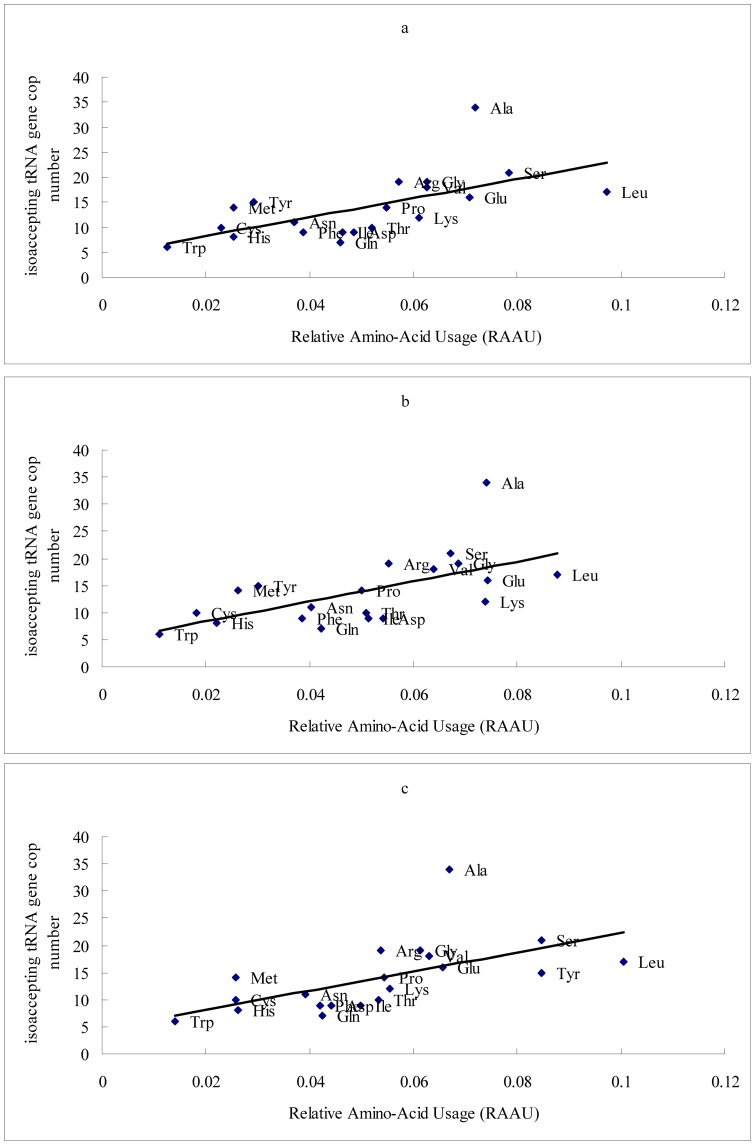
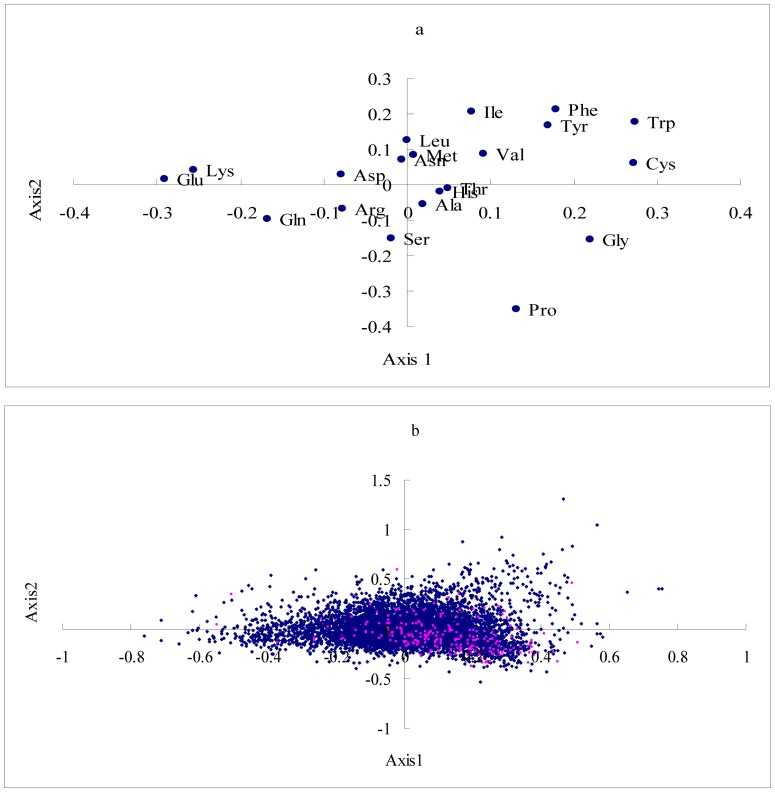
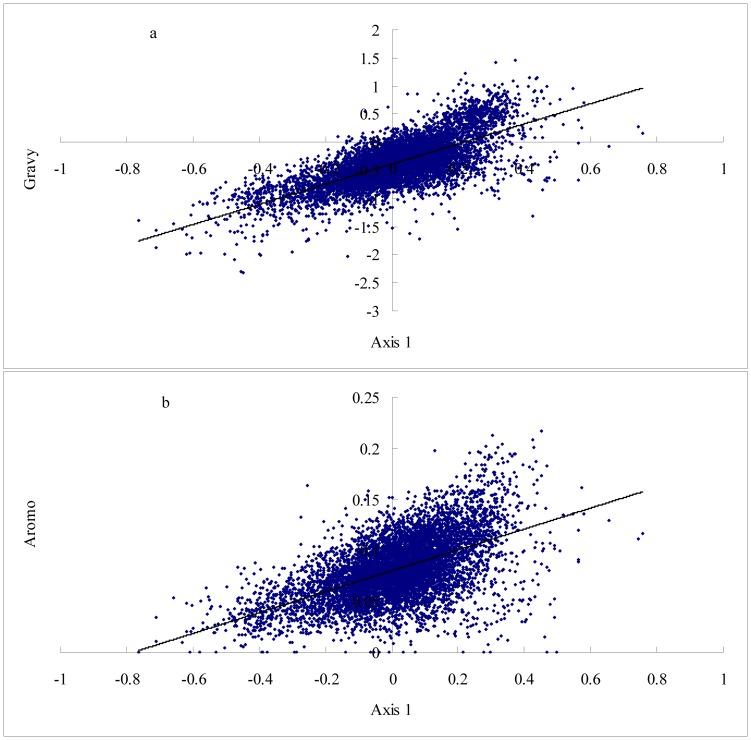
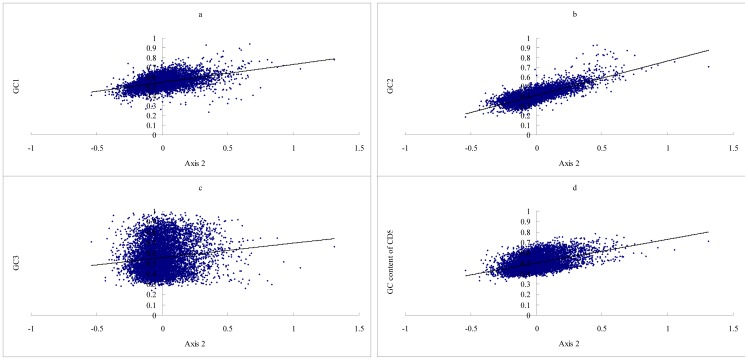
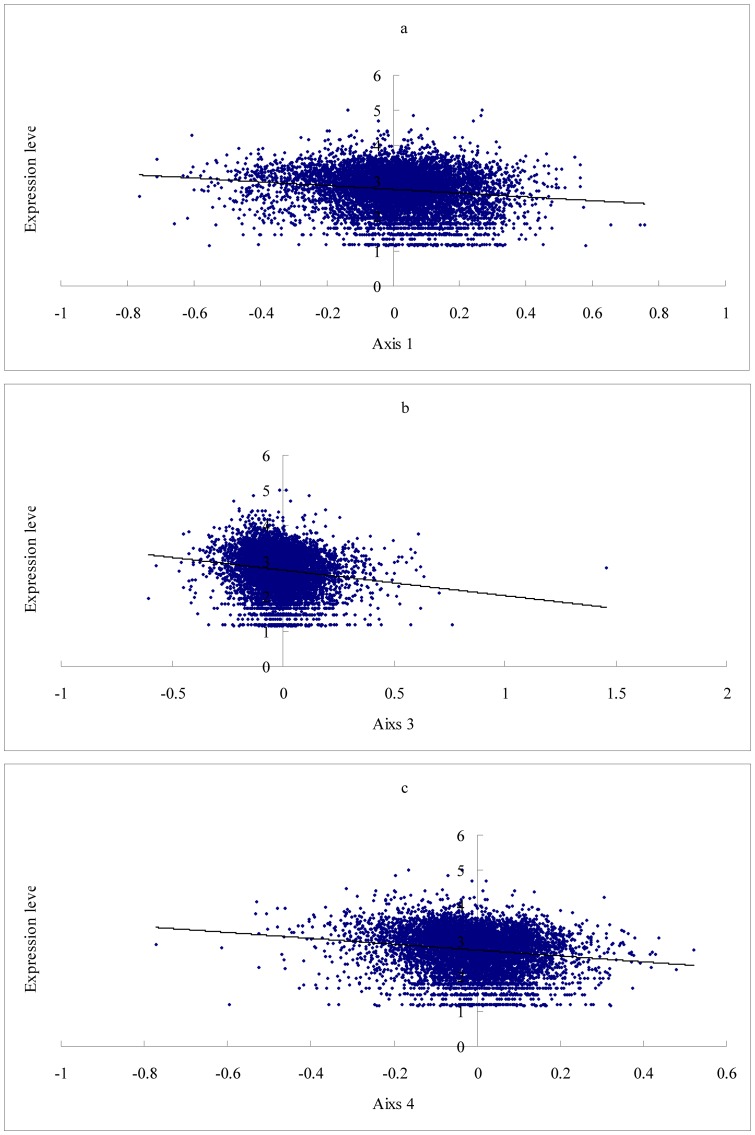
Amino acids are utilized with different frequencies both among species and among genes within the same genome. Up to date, no study on the amino acid usage pattern of chicken has been performed. In the present study, we carried out a systematic examination of the amino acid usage in the chicken proteome. Our data indicated that the relative amino acid usage is positively correlated with the tRNA gene copy number. GC contents, including GC1, GC2, GC3, GC content of CDS and GC content of the introns, were correlated with the most of the amino acid usage, especially for GC rich and GC poor amino acids, however, multiple linear regression analyses indicated that only approximately 10-40% variation of amino acid usage can be explained by GC content for GC rich and GC poor amino acids. For other intermediate GC content amino acids, only approximately 10% variation can be explained. Correspondence analyses demonstrated that the main factors responsible for the variation of amino acid usage in chicken are hydrophobicity, aromaticity and genomic GC content. Gene expression level also influenced the amino acid usage significantly. We argued that the amino acid usage of chicken proteome likely reflects a balance or near balance between the action of selection, mutation, and genetic drift.


Conflict of interest statement

Competing Interests: The authors have declared that no competing interests exist.

Figures

Figure 1
Figure 1. Relationship between the relative amino acid usage and the tRNA gene copy number.
The sequence collection contained 8631 CDSs, each corresponding to a unique gene in the Gallus gallus genome. We used 5% of the total genes with extremely high and low expression levels inferred from EST counts, as the high and low expression data set, then calculated the relative amino acid usage (RAAU) for the total data set, high expression data set and low expression data set, respectively. The tRNA gene copy numbers for each codon in the G. gallus genome was taken from http://gtrnadb.ucsc.edu/Ggall/. The isoaccepting tRNA genes were summed for each amino acid. The average RAAU values of three samples correlated with the isoaccepting tRNA gene copy number significantly. a. Relationship between the average RAAU of the total genes with the tRNA gene copy number (r  =  0.6215, P <0.0001); b. Relationship between the average RAAU of the highly expressed genes with the tRNA gene copy number (r  =  0.6578, P <0.0001); c. Relationship between the average RAAU of the lowly expressed gene with the tRNA gene copy number (r  =  0.5928, P <0.0001).
Figure 2
Figure 2. Distribution of the amino acids and genes on the first two axes of the correspondence analyses.
a. Representation of the first two axes of the correspondence analysis performed on the amino acid frequencies of the chicken protein. b. Representation of the first two axes of the correspondence analysis performed on the amino acid frequencies of 8631 chicken genes. Membrane proteins are indicated by red dots.
Figure 3
Figure 3. Relationship between Axis 1 and the GRAVY score of proteins, the Aromo score of proteins.
a. Axis 1 is strongly correlated with the GRAVY score of proteins (r  =  0.7341, P <0.0001); b. Axis 1 is strongly correlated with the Aromo score of proteins (r  =  0.5519, P <0.0001).
Figure 4
Figure 4. Relationship between Axis 2 and GC content.
a. Axis 2 is positively correlated with GC1 significantly (r  =  0.4509, P <0.0001); b. Axis 2 is strongly correlated with GC2 positively (r  =  0.7782, P <0.0001); c. Axis 2 is weakly correlated with GC3 positively (r  =  0.1361, P <0.001); d. Axis 2 is positively correlated with the GC content of CDS (r  =  0.4608, P <0.0001).
Figure 5
Figure 5. Relationship between gene expression level and Axis 1, Axis 3, and Axis4.
Chicken expression data was taken from a previous work , including 19 tissues i.e. blood, brain, bursa of fabricius, cecum, connective tissue, embryonic tissue, epiphyseal growth plate, gonad, head, heart, limb, liver, muscle, ovary, pancreas, spleen, testis, and thymus. For a given gene, expression level is the number of EST counts in all tissues (transformed to denary logarithm). a. Axis 1 is negatively correlated with gene expression level (r  =  −0.1471, P <0.0001). b. Axis 3 is negatively correlated with gene expression level (r  =  −0.1664, P <0.0001); c. Axis 4 is negatively correlated with gene expression level (r  =  −0.1578, P <0.0001).

Similar articles

Cited by

References

    1. Foster PG, Jermiin LS, Hickey DA (1997) Nucleotide composition bias affects amino acid content in proteins coded by animal mitochondria. J Mol Evol 44: 282–288. - PubMed
    1. Duret L (2000) tRNA gene number and codon usage in the C. elegans genome are co-adapted for optimal translation of highly expressed genes. Trends Genet 16: 287–289. - PubMed
    1. Kanaya S, Yamada Y, Kudo Y, Ikemura T (1999) Studies of codon usage and tRNA genes of 18 unicellular organisms and quantification of Bacillus subtilis tRNAs: gene expression level and species-specific diversity of codon usage based on multivariate analysis. Gene 238: 143–155. - PubMed
    1. Behura SK, Severson DW (2011) Coadaptation of isoacceptor tRNA genes and codon usage bias for translation efficiency in Aedes aegypti and Anopheles gambiae. Insect Mol Biol 20(2): 177–87. - PMC - PubMed
    1. Novoa EM, Ribas de Pouplana L (2012) Speeding with control: codon usage, tRNAs, and ribosomes. Trends Genet 28(11): 574–81. - PubMed

Publication types

LinkOut - more resources