

Canonical correlation analysis for gene-based pleiotropy discovery
- PMID: 25329069
- PMCID: PMC4199483
- DOI: 10.1371/journal.pcbi.1003876
Canonical correlation analysis for gene-based pleiotropy discovery
Abstract
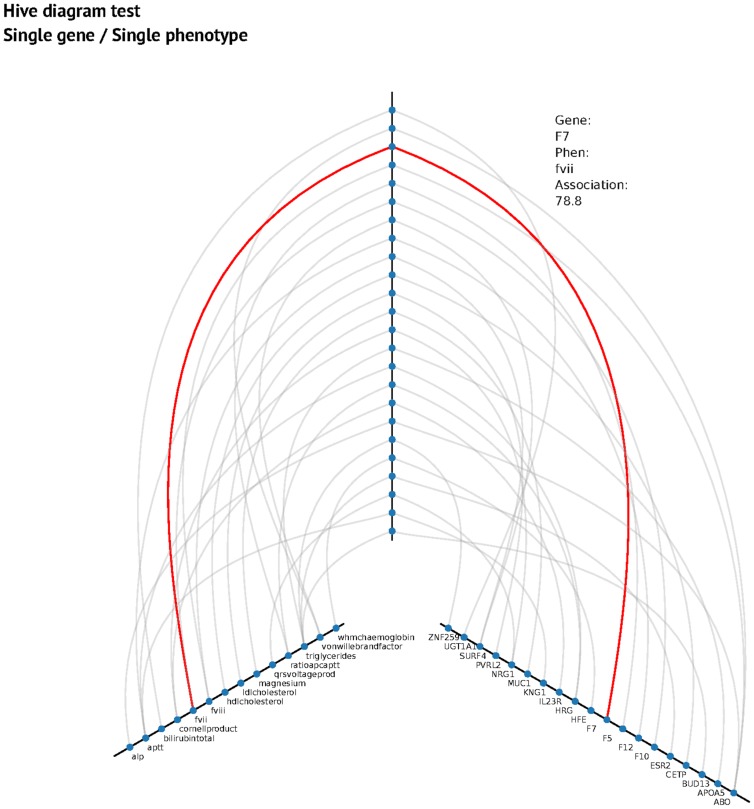
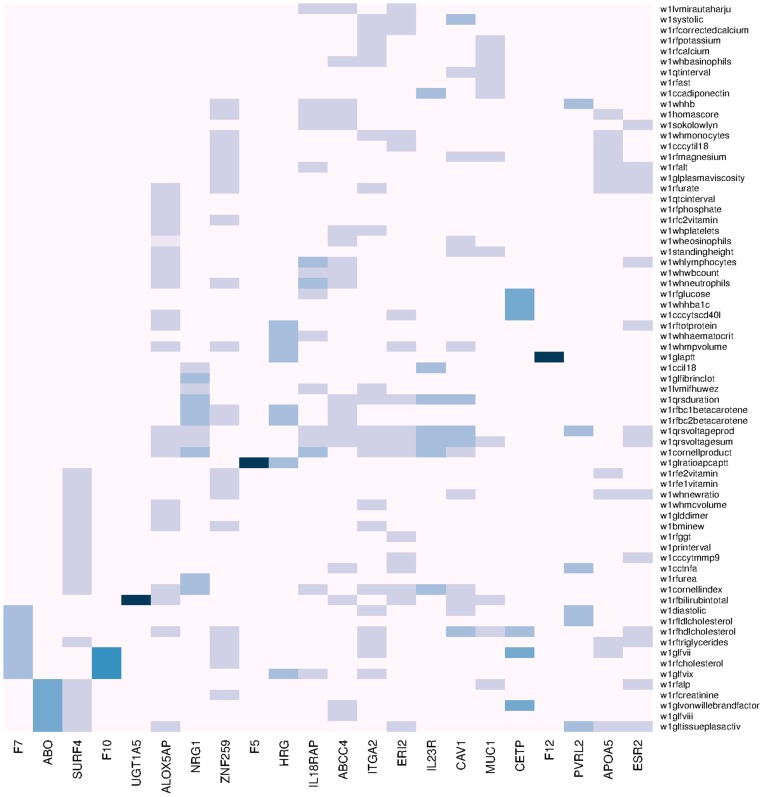
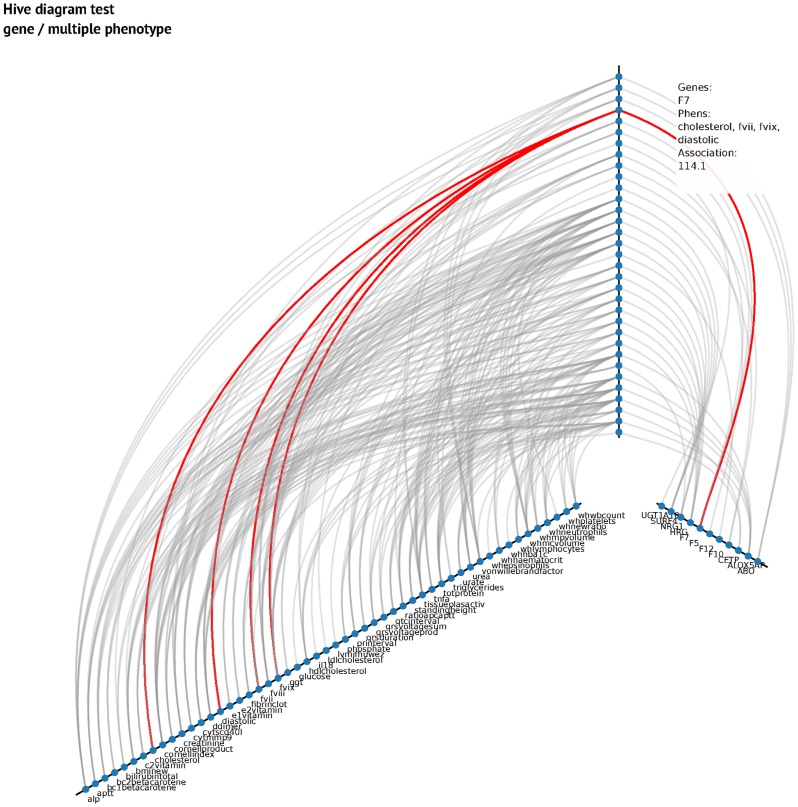
Genome-wide association studies have identified a wealth of genetic variants involved in complex traits and multifactorial diseases. There is now considerable interest in testing variants for association with multiple phenotypes (pleiotropy) and for testing multiple variants for association with a single phenotype (gene-based association tests). Such approaches can increase statistical power by combining evidence for association over multiple phenotypes or genetic variants respectively. Canonical Correlation Analysis (CCA) measures the correlation between two sets of multidimensional variables, and thus offers the potential to combine these two approaches. To apply CCA, we must restrict the number of attributes relative to the number of samples. Hence we consider modules of genetic variation that can comprise a gene, a pathway or another biologically relevant grouping, and/or a set of phenotypes. In order to do this, we use an attribute selection strategy based on a binary genetic algorithm. Applied to a UK-based prospective cohort study of 4286 women (the British Women's Heart and Health Study), we find improved statistical power in the detection of previously reported genetic associations, and identify a number of novel pleiotropic associations between genetic variants and phenotypes. New discoveries include gene-based association of NSF with triglyceride levels and several genes (ACSM3, ERI2, IL18RAP, IL23RAP and NRG1) with left ventricular hypertrophy phenotypes. In multiple-phenotype analyses we find association of NRG1 with left ventricular hypertrophy phenotypes, fibrinogen and urea and pleiotropic relationships of F7 and F10 with Factor VII, Factor IX and cholesterol levels.
Conflict of interest statement
The authors have declared that no competing interests exist.
Figures
References
-
- Hadorn E, MITTWOCH U (1961) Developmental genetics and lethal factors. The American Journal of the Medical Sciences 242: 522.
-
- Li SY, Williams BL, Cui YH (2011) A combined p-value approach to infer pathway regulations in eQTL mapping. Statistics and Its Interface 4: 389–401.
Publication types
MeSH terms
Substances
Grants and funding
LinkOut - more resources
Full Text Sources
Other Literature Sources
Miscellaneous
