

Improved methodical approach for quantitative BRET analysis of G Protein Coupled Receptor dimerization
- PMID: 25329164
- PMCID: PMC4201472
- DOI: 10.1371/journal.pone.0109503
Improved methodical approach for quantitative BRET analysis of G Protein Coupled Receptor dimerization
Erratum in
-
Correction: Improved Methodical Approach for Quantitative BRET Analysis of G Protein Coupled Receptor Dimerization.PLoS One. 2016 May 31;11(5):e0156824. doi: 10.1371/journal.pone.0156824. eCollection 2016. PLoS One. 2016. PMID: 27243812 Free PMC article.
Abstract
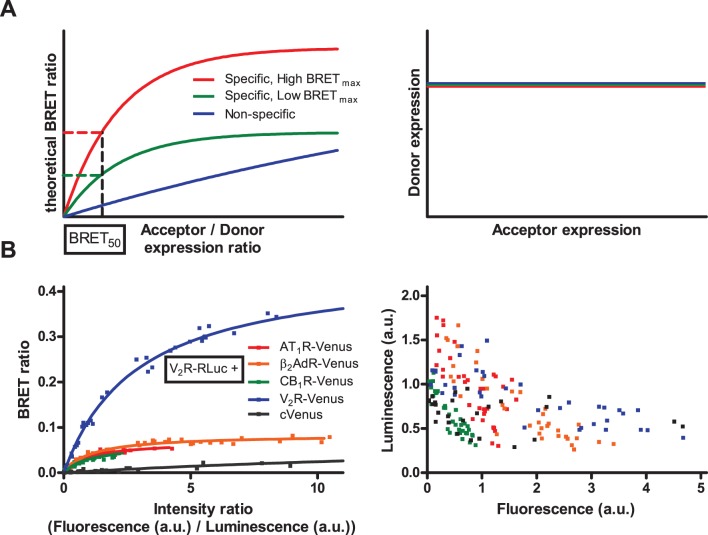
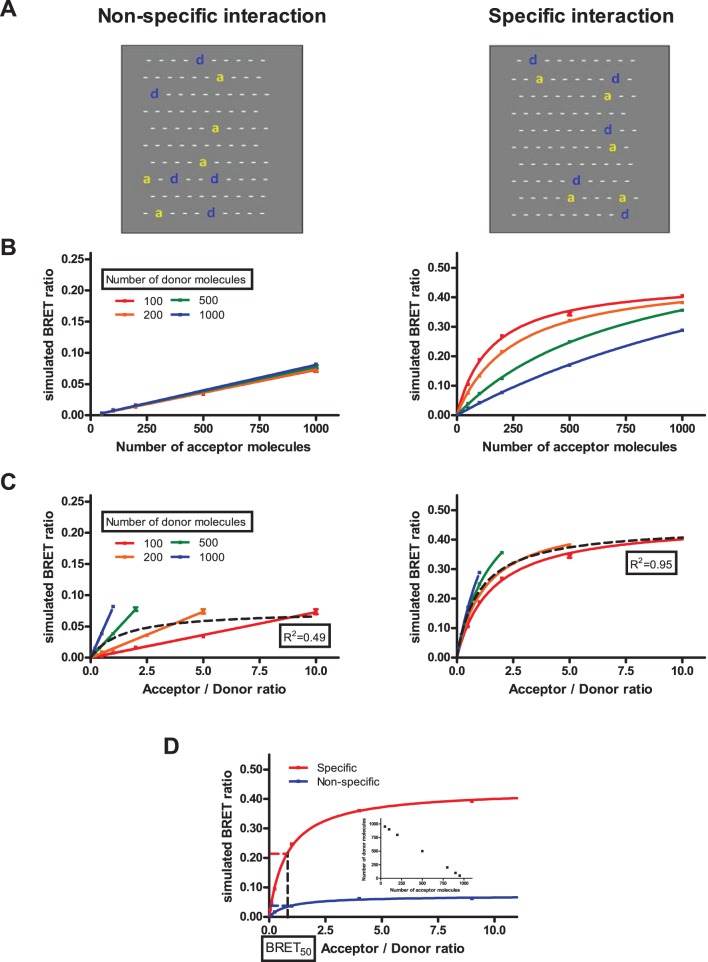
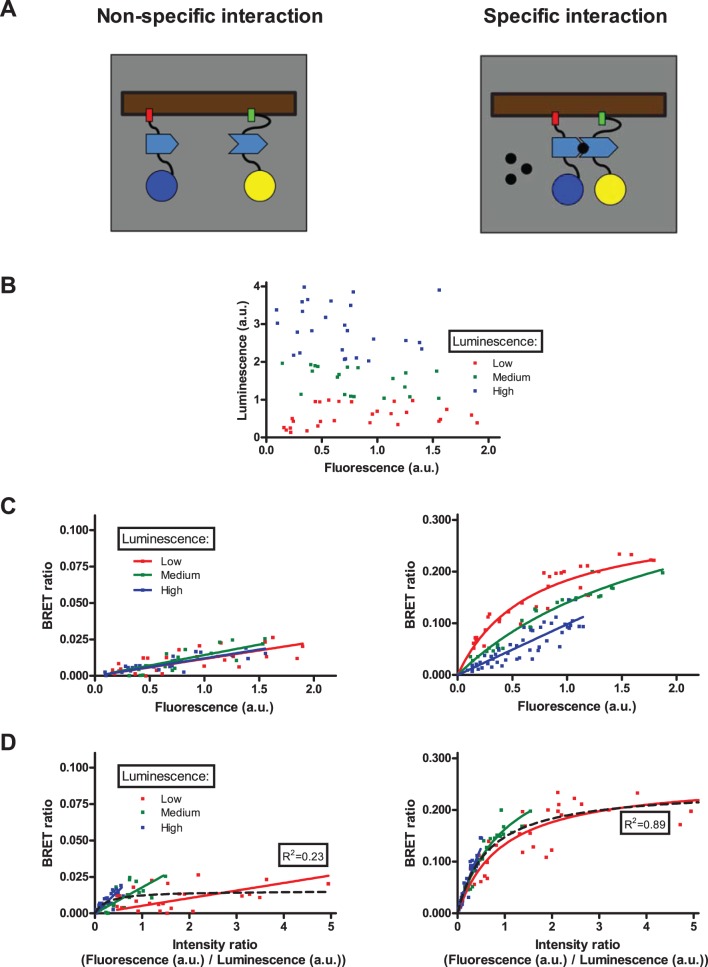
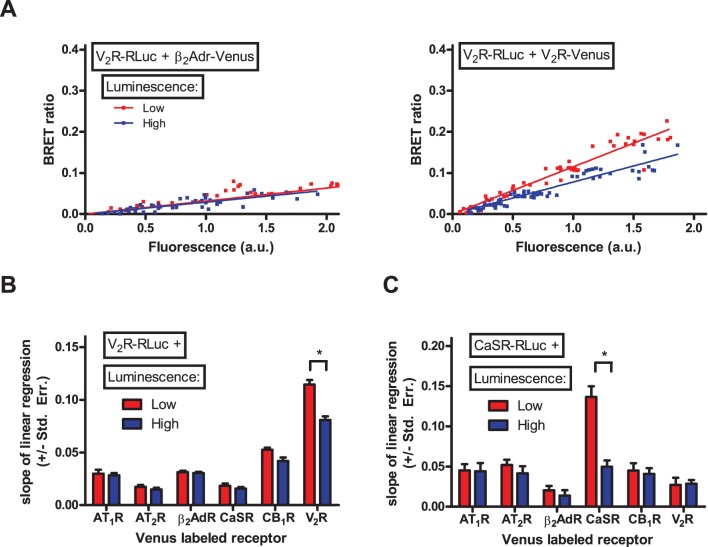
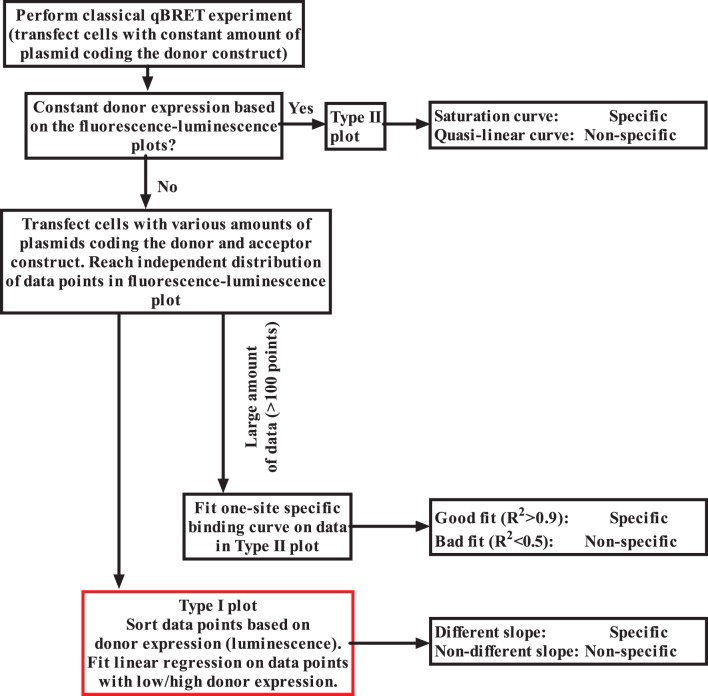
G Protein Coupled Receptors (GPCR) can form dimers or higher ordered oligomers, the process of which can remarkably influence the physiological and pharmacological function of these receptors. Quantitative Bioluminescence Resonance Energy Transfer (qBRET) measurements are the gold standards to prove the direct physical interaction between the protomers of presumed GPCR dimers. For the correct interpretation of these experiments, the expression of the energy donor Renilla luciferase labeled receptor has to be maintained constant, which is hard to achieve in expression systems. To analyze the effects of non-constant donor expression on qBRET curves, we performed Monte Carlo simulations. Our results show that the decrease of donor expression can lead to saturation qBRET curves even if the interaction between donor and acceptor labeled receptors is non-specific leading to false interpretation of the dimerization state. We suggest here a new approach to the analysis of qBRET data, when the BRET ratio is plotted as a function of the acceptor labeled receptor expression at various donor receptor expression levels. With this method, we were able to distinguish between dimerization and non-specific interaction when the results of classical qBRET experiments were ambiguous. The simulation results were confirmed experimentally using rapamycin inducible heterodimerization system. We used this new method to investigate the dimerization of various GPCRs, and our data have confirmed the homodimerization of V2 vasopressin and CaSR calcium sensing receptors, whereas our data argue against the heterodimerization of these receptors with other studied GPCRs, including type I and II angiotensin, β2 adrenergic and CB1 cannabinoid receptors.
Conflict of interest statement
Figures
Similar articles
-
Bioluminescence resonance energy transfer methods to study G protein-coupled receptor-receptor tyrosine kinase heteroreceptor complexes.Methods Cell Biol. 2013;117:141-64. doi: 10.1016/B978-0-12-408143-7.00008-6. Methods Cell Biol. 2013. PMID: 24143976 Free PMC article.
-
A novel approach to quantify G-protein-coupled receptor dimerization equilibrium using bioluminescence resonance energy transfer.Methods Mol Biol. 2013;1013:93-127. doi: 10.1007/978-1-62703-426-5_7. Methods Mol Biol. 2013. PMID: 23625495 Free PMC article.
-
Methods to Monitor the Trafficking of β-Arrestin/G Protein-Coupled Receptor Complexes Using Enhanced Bystander BRET.Methods Mol Biol. 2019;1957:59-68. doi: 10.1007/978-1-4939-9158-7_3. Methods Mol Biol. 2019. PMID: 30919346
-
Past, present and future of vasopressin and oxytocin receptor oligomers, prototypical GPCR models to study dimerization processes.Curr Opin Pharmacol. 2010 Feb;10(1):59-66. doi: 10.1016/j.coph.2009.10.003. Epub 2009 Nov 5. Curr Opin Pharmacol. 2010. PMID: 19896898 Review.
-
Application of BRET for studying G protein-coupled receptors.Mini Rev Med Chem. 2014 May;14(5):411-25. doi: 10.2174/1389557514666140428113708. Mini Rev Med Chem. 2014. PMID: 24766382 Review.
Cited by
-
G protein-coupled estrogen receptor (GPER)/GPR30 forms a complex with the β1-adrenergic receptor, a membrane-associated guanylate kinase (MAGUK) scaffold protein, and protein kinase A anchoring protein (AKAP) 5 in MCF7 breast cancer cells.Arch Biochem Biophys. 2024 Feb;752:109882. doi: 10.1016/j.abb.2024.109882. Epub 2024 Jan 10. Arch Biochem Biophys. 2024. PMID: 38211639 Free PMC article.
-
Heterologous phosphorylation-induced formation of a stability lock permits regulation of inactive receptors by β-arrestins.J Biol Chem. 2018 Jan 19;293(3):876-892. doi: 10.1074/jbc.M117.813139. Epub 2017 Nov 16. J Biol Chem. 2018. PMID: 29146594 Free PMC article.
-
Agonist bias and agonist-dependent antagonism at corticotrophin releasing factor receptors.Pharmacol Res Perspect. 2020 Jun;8(3):e00595. doi: 10.1002/prp2.595. Pharmacol Res Perspect. 2020. PMID: 32529807 Free PMC article.
-
Correction: Improved Methodical Approach for Quantitative BRET Analysis of G Protein Coupled Receptor Dimerization.PLoS One. 2016 May 31;11(5):e0156824. doi: 10.1371/journal.pone.0156824. eCollection 2016. PLoS One. 2016. PMID: 27243812 Free PMC article.
-
Quantifying lipid changes in various membrane compartments using lipid binding protein domains.Cell Calcium. 2017 Jun;64:72-82. doi: 10.1016/j.ceca.2016.12.008. Epub 2016 Dec 31. Cell Calcium. 2017. PMID: 28088320 Free PMC article. Review.
References
-
- Szidonya L, Cserzo M, Hunyady L (2008) Dimerization and oligomerization of G-protein-coupled receptors: debated structures with established and emerging functions. J Endocrinol 196(3): 435–453. - PubMed
-
- Kaupmann K, Malitschek B, Schuler V, Heid J, Froestl W, et al. (1998) GABA(B)-receptor subtypes assemble into functional heteromeric complexes. Nature 396(6712): 683–687. - PubMed
Publication types
MeSH terms
Substances
LinkOut - more resources
Full Text Sources
Other Literature Sources
