. 2014 Dec;20(12):1410-1416.
doi: 10.1038/nm.3746. Epub 2014 Oct 20.

Autosomal dominant immune dysregulation syndrome in humans with CTLA4 mutations

Affiliations

Autosomal dominant immune dysregulation syndrome in humans with CTLA4 mutations

Desirée Schubert et al. Nat Med. 2014 Dec.

Abstract

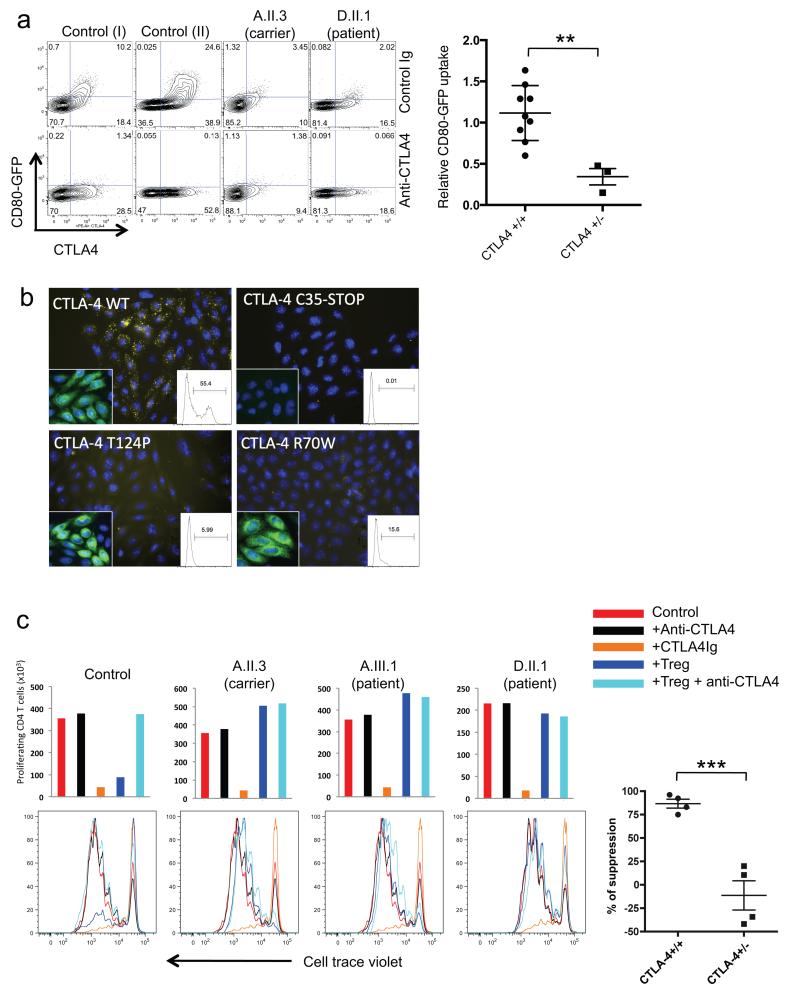
The protein cytotoxic T lymphocyte antigen-4 (CTLA-4) is an essential negative regulator of immune responses, and its loss causes fatal autoimmunity in mice. We studied a large family in which five individuals presented with a complex, autosomal dominant immune dysregulation syndrome characterized by hypogammaglobulinemia, recurrent infections and multiple autoimmune clinical features. We identified a heterozygous nonsense mutation in exon 1 of CTLA4. Screening of 71 unrelated patients with comparable clinical phenotypes identified five additional families (nine individuals) with previously undescribed splice site and missense mutations in CTLA4. Clinical penetrance was incomplete (eight adults of a total of 19 genetically proven CTLA4 mutation carriers were considered unaffected). However, CTLA-4 protein expression was decreased in regulatory T cells (Treg cells) in both patients and carriers with CTLA4 mutations. Whereas Treg cells were generally present at elevated numbers in these individuals, their suppressive function, CTLA-4 ligand binding and transendocytosis of CD80 were impaired. Mutations in CTLA4 were also associated with decreased circulating B cell numbers. Taken together, mutations in CTLA4 resulting in CTLA-4 haploinsufficiency or impaired ligand binding result in disrupted T and B cell homeostasis and a complex immune dysregulation syndrome.


Figures

Figure 1
Figure 1. Genetics and pedigrees of families with CTLA4 mutations
(a) Pedigrees of families with CTLA4 mutations. Squares: male subjects; circles: female subjects; black filled symbols: patients with mutation; gray filled symbols: mutation carriers; crossed-out symbols: deceased subjects. CTLA4 was sequenced in all individuals with available gDNA (asterisk). Whole exome sequencing was carried out on subjects with a pink asterisk. (b) Confirmation of the mutations by Sanger sequencing showing cDNA (c) changes and their resulting amino acid (p) changes.
Figure 2
Figure 2. Tissue infiltration and lymphadenopathy in patients with CTLA4 mutations
Duodenal biopsies stained for CD4 (patient B.II.4 (a) and A.III.3 (b)). (c) High resolution chest CT scan of the lungs (from patient E.II.3). (d) Pulmonary lymphoid fibrotic lesions stained for CD4 in pulmonary biopsies (from patient E.II.3). (e) Magnetic resonance imaging (MRI) of the pelvic area with two enlarged lymph nodes (arrows) measuring up to 5 cm (from patient A.III.3). (f) Bone marrow biopsy stained for CD4 (from patient B.II.4). (g) MRI of Gadolinium-enhanced lesions (arrows) in the cerebellum (from patient A.III.1) (h) Resected cerebellar lesion stained for CD3 (from patient A.III.1). Scale bars, 50 μm (a,b,d,f,h).
Figure 3
Figure 3. Impact of CTLA4 heterozygosity on T and B cells
(a) Percentage of naïve CD4+CD45RA+ T cells, CD19+ B cells and CD19+IgMCD27+ switched memory B cells in the peripheral blood of CTLA4+/− carriers and patients. Gray background indicates normal range. ● Family A, ▴ Family B, ▾ Family C, ∎ Family D. (b) Proportion of IFN-γ+, IL-4+ and and IL-17+ expressing CD3+CD4+CD45RO+ T cells after stimulation of PBMCs with PMA and Ionomycin in healthy CTLA4+/+, CTLA4+/− carriers and CTLA4+/− patients. (c) Percentage of FOXP3+ Treg cells amongst CD4+ T cells in the peripheral blood under resting (ex vivo) conditions or following activation (with beads containing CD3- and CD28-specific antibodies. (d) Representative flow cytometry plots (top) and quantification (bottom) of CTLA-4 expression in CD4+FOXP3+ cells under resting and activated conditions. (Resting: P=0.0130; Activated: P=0.0065). Numbers in quadrants show percentage of CTLA-4 high (top), intermediate (middle) and low (bottom) expressing cells within the FOXP3+ population. Plots in b, c and d show the mean +/− SD; each dot represents one individual. P values were determined by Student’s t test. *P≤0.05; **P≤0.01, ***P≤0.001, ****P≤0.0001.
Figure 4
Figure 4. Impaired transendocytosis, ligand binding and Treg suppressive activity in CTLA4 heterozygotes
(a) Transendocytosis of CD80-GFP by stimulated primary CD4+FOXP3+ Treg cells in the presence or absence of CTLA-4 blockade. Flow cytometry plots depict CD80-GFP uptake by Treg cells in the absence (upper panels) and presence (lower panels) of CTLA-4 blockade. Dot plot shows the relative CD80-GFP uptake in homozygous versus heterozygous individuals P = 0.0091. (n=9 CTLA4+/+, n=3 CTLA4+/−). (b) (Main panel) Uptake of CD80-Ig (yellow) by CHO cells expressing wild-type and mutant CTLA4. (Right, inset) Flow cytometric analysis of CD80-Ig staining in CHO cells (x axis, CD80-Ig staining; y axis, relative cell number). (Left, inset) CTLA-4 expression (green) in CHO cells, as assessed by staining with an antibody to the C-terminus of CTLA-4. Images are representative of 4 independent experiments. (c) Proliferation of cell trace-labeled CD4+ responder T cells upon co-culture with monocyte-derived dendritic cells and CD3-specific antibodies with or without CD4+CD25+ Treg cells, CTLA-4 Ig or CTLA-4-specific blocking antibodies. Quantification of total proliferating T cell numbers (top) and flow cytometry histograms depicting cell division of responder T cells in suppression assays. P values were determined by Student’s t test. ** P<0.01, *** P<0.001.

References

    1. Al-Herz W, et al. Primary immunodeficiency diseases: an update on the classification from the international union of immunological societies expert committee for primary immunodeficiency. Front Immunol. 2014;5:162. - PMC - PubMed
    1. Resnick ES, Cunningham-Rundles C. The many faces of the clinical picture of common variable immune deficiency. Curr Opin Allergy Clin Immunol. 2012;12:595–601. - PubMed
    1. Yong PF, Thaventhiran JE, Grimbacher B. “A rose is a rose is a rose,” but CVID is Not CVID common variable immune deficiency (CVID), what do we know in 2011? Adv Immunol. 2011;111:47–107. - PubMed
    1. Gathmann B, et al. Clinical picture and treatment of 2212 patients with common variable immunodeficiency. J Allergy Clin Immunol. 2014;134:116–126. - PubMed
    1. Chen K, et al. Germline mutations in NFKB2 implicate the noncanonical NF-kappaB pathway in the pathogenesis of common variable immunodeficiency. Am J Hum Genet. 2013;93:812–824. - PMC - PubMed

Publication types

MeSH terms

Supplementary concepts