. 2014 Oct 20;9(10):e109291.
doi: 10.1371/journal.pone.0109291. eCollection 2014.

Systematic analysis of blood cell transcriptome in end-stage chronic respiratory diseases

Collaborators, Affiliations

Systematic analysis of blood cell transcriptome in end-stage chronic respiratory diseases

Julie Chesné et al. PLoS One. .

Abstract

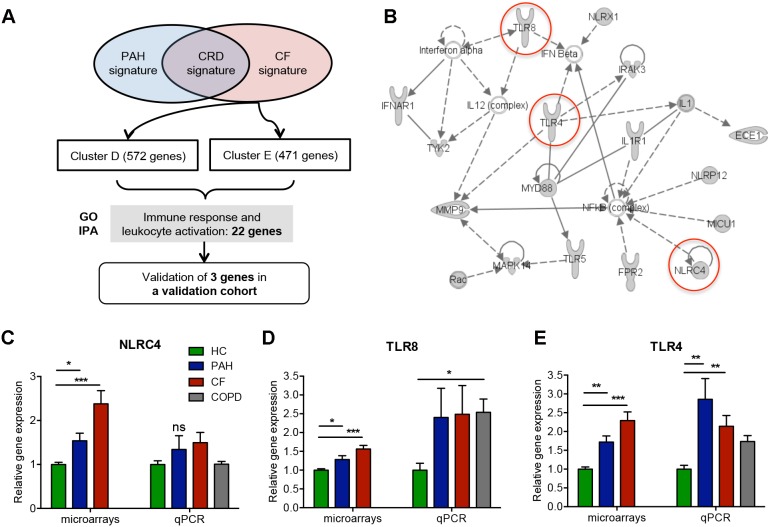
Background: End-stage chronic respiratory diseases (CRD) have systemic consequences, such as weight loss and susceptibility to infection. However the mechanisms of such dysfunctions are as yet poorly explained. We hypothesized that the genes putatively involved in these mechanisms would emerge from a systematic analysis of blood mRNA profiles from pre-transplant patients with cystic fibrosis (CF), pulmonary hypertension (PAH), and chronic obstructive pulmonary disease (COPD).

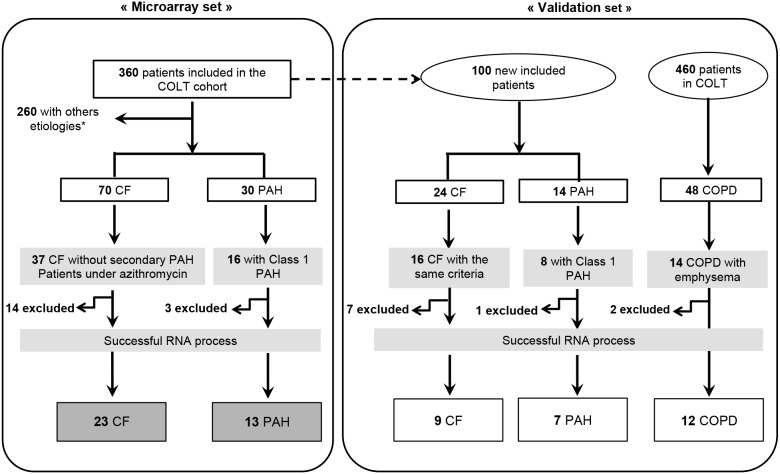
Methods: Whole blood was first collected from 13 patients with PAH, 23 patients with CF, and 28 Healthy Controls (HC). Microarray results were validated by quantitative PCR on a second and independent group (7PAH, 9CF, and 11HC). Twelve pre-transplant COPD patients were added to validate the common signature shared by patients with CRD for all causes. To further clarify a role for hypoxia in the candidate gene dysregulation, peripheral blood mononuclear cells from HC were analysed for their mRNA profile under hypoxia.

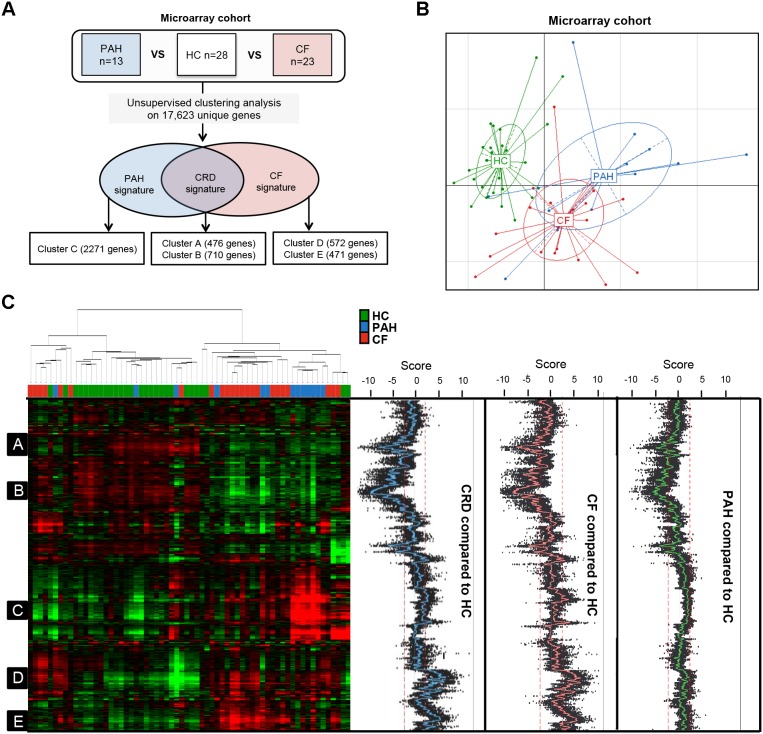
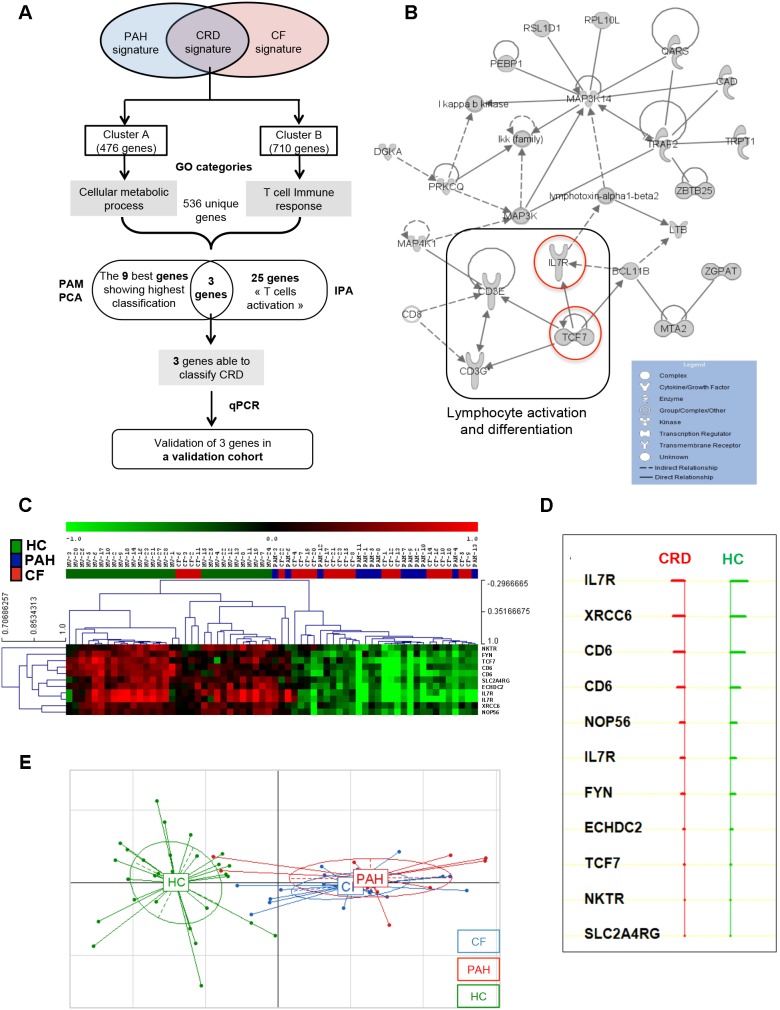
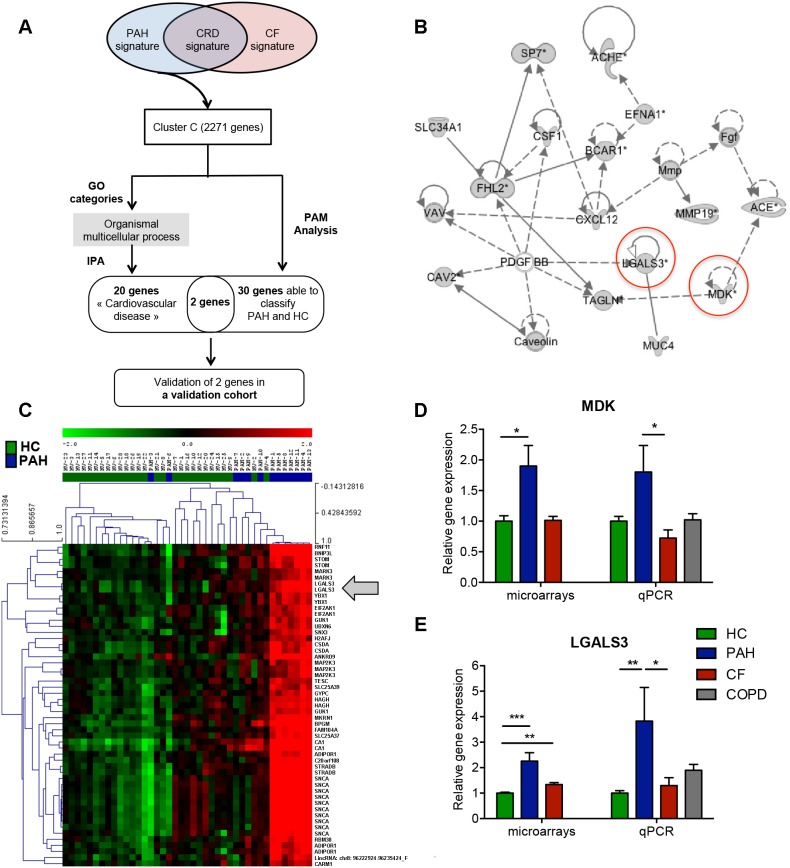
Results: Unsupervised hierarchical clustering allowed the identification of 3 gene signatures related to CRD. One was common to CF and PAH, another specific to CF, and the final one was specific to PAH. With the common signature, we validated T-Cell Factor 7 (TCF-7) and Interleukin 7 Receptor (IL-7R), two genes related to T lymphocyte activation, as being under-expressed. We showed a strong impact of the hypoxia on modulation of TCF-7 and IL-7R expression in PBMCs from HC under hypoxia or PBMCs from CRD. In addition, we identified and validated genes upregulated in PAH or CF, including Lectin Galactoside-binding Soluble 3 and Toll Like Receptor 4, respectively.

Conclusions: Systematic analysis of blood cell transcriptome in CRD patients identified common and specific signatures relevant to the systemic pathologies. TCF-7 and IL-7R were downregulated whatever the cause of CRD and this could play a role in the higher susceptibility to infection of these patients.


Conflict of interest statement

Competing Interests: The authors have declared that no competing interests exist.

Figures

Figure 1
Figure 1. Strategy for selecting patients from the COLT (COhort of Lung Transplantation).
*Emphysema, Sarcoïdosis, Lymphangiomatosis, Secondary PAH, histiocytosis, fibrosis, bronchiectasis and COPD (Chronic Obstructive Pulmonary Disease). CF: Cystic Fibrosis; PAH: Pulmonary Arterial hypertension; COPD: Chronic Obstructive Pulmonary Disease. Patients were excluded during the RNA process following specific qualities criteria.
Figure 2
Figure 2. Unsupervised hierarchical clustering analysis.
A) Tree analysis. Clustering analysis based on the 30,146 probes corresponding to 17,163 unique genes expressed in PAH, CF patients and Healthy Controls (HC). 3 signatures were found: 1 common between CF and PAH (named CRD signature), 1 specific to CF and 1 to PAH; B) Principal Component Analysis (PCA) displayed a clear separation between HC and patients with CRD, whereas CF and PAH patients were less distinct; C) 5 groups of genes (or clusters) were selected, A to E, based on a combined approach: selected genes were clustered together and exhibited a t-test p-value below 1% between the CRD group (PAH+CF), CF or PAH versus HC. Green represents relatively low expression, and red indicates relatively high expression.
Figure 3
Figure 3. Characterization of under-expressed genes in the CRD signature.
A) Tree analysis of the CRD signature. Identification of the most representative genes by Gominer, PAM, IPA analysis and validation of the candidate genes in the validation cohort by qPCR; B) Network generated by IPA on the most significant GO categories in the CRD signature. Solid lines indicate direct interactions and dashed lines represent indirect interactions. Under-expressed genes in CRD are in gray. C) PAM analysis based on the most representative GO categories of Cluster A and B. Green represents relatively low expression, and red indicates relatively high expression. D) List of 9 genes able to classify correctly CRD and HC. E) The PCA graph of the 9 genes identified by PAM analysis indicated a clear separation between HC and patients with CRD (CF and PAH).
Figure 4
Figure 4. Validation of the most representative genes in the validation cohort.
A) Quantitative PCR validation of 3 genes from the PAM analysis (IL-7R, TCF-7 and CD6) using the validation cohort; B) based on these qPCR values, IL-7R and TCF-7 enabled good discrimination between patients with CRD and HC, according to a receiver operating characteristic (ROC) analysis (AUC = 89.6% with p<0.001 and AUC = 89.4% with p<0.001, respectively); C) Median intensity fluorescence (MFI) and mRNA expression of IL-7R in PBMCs from healthy controls (HC) cultivated 12 hours under hypoxic and normoxic condition; D) MFI of IL-7R on PBMCs from CRD patients compared to HC; E) TCF-7 expression in PBMCs from HC under hypoxia or normoxia.
Figure 5
Figure 5. Characterization of over-expressed genes in the PAH signature.
A) Tree analysis of the PAH signature. Identification of the most representative genes by Gominer, PAM, IPA analysis and validation by qPCR of the candidate genes in the validation cohort; B) Network generated by IPA on the most significant GO categories in PAH signature. Over-expressed genes in PAH are in gray. C) PAM analysis based on the cluster, Green represents relatively low expression, and red indicates relatively high expression; D and E) Validation by qPCR of MDK and LGALS3 in the validation cohort, respectively.
Figure 6
Figure 6. Characterization of over-expressed genes in the CF signature.
A) Tree analysis of CF signature. Identification of the most representative genes by Gominer and IPA analysis and validation by qPCR of these genes in the validation cohort; B) Network generated by IPA on the most significant GO categories in CF signature. Over-expressed genes in CF are in gray; C, D, E) qPCR validation on the new cohort for NLRC4, TLR8 and TLR4 genes.

References

    1. Chailleux E, Fauroux B, Binet F, Dautzenberg B, Polu JM (1996) Predictors of survival in patients receiving domiciliary oxygen therapy or mechanical ventilation. A 10-year analysis of ANTADIR Observatory. CHEST 109: 741–749. - PubMed
    1. Barnes PJ (2000) Chronic obstructive pulmonary disease. N Engl J Med 343: 269–280 10.1056/NEJM200007273430407 - DOI - PubMed
    1. Ratjen F, Döring G (2003) Cystic fibrosis. Lancet 361: 681–689 10.1016/S0140-6736(03)12567-6 - DOI - PubMed
    1. Humbert M, Sitbon O, Simonneau G (2004) Treatment of pulmonary arterial hypertension. N Engl J Med 351: 1425–1436 10.1056/NEJMra040291 - DOI - PubMed
    1. Price LC, Wort SJ, Perros F, Dorfmüller P, Huertas A, et al. (2012) Inflammation in pulmonary arterial hypertension. CHEST 141: 210–221 10.1378/chest.11-0793 - DOI - PubMed

Publication types

MeSH terms