

Cadmium telluride quantum dots (CdTe-QDs) and enhanced ultraviolet-B (UV-B) radiation trigger antioxidant enzyme metabolism and programmed cell death in wheat seedlings
- PMID: 25329900
- PMCID: PMC4203795
- DOI: 10.1371/journal.pone.0110400
Cadmium telluride quantum dots (CdTe-QDs) and enhanced ultraviolet-B (UV-B) radiation trigger antioxidant enzyme metabolism and programmed cell death in wheat seedlings
Abstract
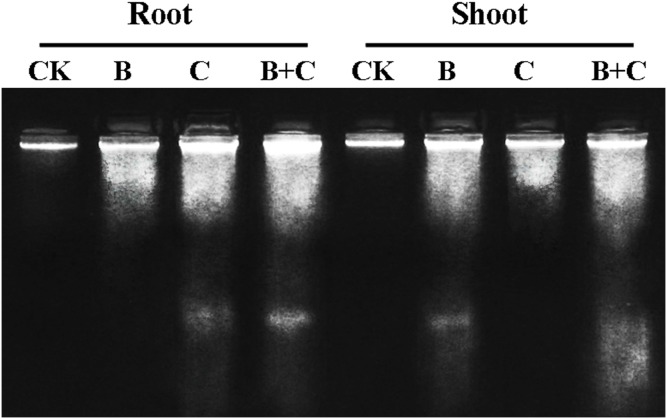
Nanoparticles (NPs) are becoming increasingly widespread in the environment. Free cadmium ions released from commonly used NPs under ultraviolet-B (UV-B) radiation are potentially toxic to living organisms. With increasing levels of UV-B radiation at the Earth's surface due to the depletion of the ozone layer, the potential additive effect of NPs and UV-B radiation on plants is of concern. In this study, we investigated the synergistic effect of CdTe quantum dots (CdTe-QDs), a common form of NP, and UV-B radiation on wheat seedlings. Graded doses of CdTe-QDs and UV-B radiation were tested, either alone or in combination, based on physical characteristics of 5-day-old seedlings. Treatments of wheat seedlings with either CdTe-QDs (200 mg/L) or UV-B radiation (10 KJ/m(2)/d) induced the activation of wheat antioxidant enzymes. CdTe-QDs accumulation in plant root cells resulted in programmed cell death as detected by DNA laddering. CdTe-QDs and UV-B radiation inhibited root and shoot growth, respectively. Additive inhibitory effects were observed in the combined treatment group. This research described the effects of UV-B and CdTe-QDs on plant growth. Furthermore, the finding that CdTe-QDs accumulate during the life cycle of plants highlights the need for sustained assessments of these interactions.
Conflict of interest statement
Figures


Similar articles
-
UV-enhanced cytotoxicity of CdTe quantum dots in PANC-1 cells depend on their size distribution and surface modification.J Nanosci Nanotechnol. 2013 Feb;13(2):751-4. doi: 10.1166/jnn.2013.6085. J Nanosci Nanotechnol. 2013. PMID: 23646509
-
Cytotoxicity of CdTe quantum dots in human umbilical vein endothelial cells: the involvement of cellular uptake and induction of pro-apoptotic endoplasmic reticulum stress.Int J Nanomedicine. 2016 Feb 2;11:529-42. doi: 10.2147/IJN.S93591. eCollection 2016. Int J Nanomedicine. 2016. PMID: 26893560 Free PMC article.
-
Decorating CdTe QD-Embedded Mesoporous Silica Nanospheres with Ag NPs to Prevent Bacteria Invasion for Enhanced Anticounterfeit Applications.ACS Appl Mater Interfaces. 2015 May 13;7(18):10022-33. doi: 10.1021/acsami.5b02472. Epub 2015 May 1. ACS Appl Mater Interfaces. 2015. PMID: 25901940
-
CdTe and CdSe quantum dots cytotoxicity: a comparative study on microorganisms.Sensors (Basel). 2011;11(12):11664-78. doi: 10.3390/s111211664. Epub 2011 Dec 15. Sensors (Basel). 2011. PMID: 22247686 Free PMC article. Review.
-
Ultraviolet Radiation From a Plant Perspective: The Plant-Microorganism Context.Front Plant Sci. 2020 Dec 15;11:597642. doi: 10.3389/fpls.2020.597642. eCollection 2020. Front Plant Sci. 2020. PMID: 33384704 Free PMC article. Review.
Cited by
-
CdTe-QDs Affect Reproductive Development of Plants through Oxidative Stress.Toxics. 2023 Jul 5;11(7):585. doi: 10.3390/toxics11070585. Toxics. 2023. PMID: 37505551 Free PMC article.
-
Gene Expression and Transcriptome Profiling of Changes in a Cancer Cell Line Post-Exposure to Cadmium Telluride Quantum Dots: Possible Implications in Oncogenesis.Dose Response. 2021 Jun 11;19(2):15593258211019880. doi: 10.1177/15593258211019880. eCollection 2021 Apr-Jun. Dose Response. 2021. PMID: 34177396 Free PMC article.
-
Assessing the Environmental Effects Related to Quantum Dot Structure, Function, Synthesis and Exposure.Environ Sci Nano. 2022 Mar 1;9(3):867-910. doi: 10.1039/d1en00712b. Environ Sci Nano. 2022. PMID: 35401985 Free PMC article.
-
Nanomaterials coupled with microRNAs for alleviating plant stress: a new opening towards sustainable agriculture.Physiol Mol Biol Plants. 2022 Apr;28(4):791-818. doi: 10.1007/s12298-022-01163-x. Epub 2022 Apr 26. Physiol Mol Biol Plants. 2022. PMID: 35592477 Free PMC article. Review.
-
Toxicity of Bacillus thuringiensis Strains Derived from the Novel Crystal Protein Cry31Aa with High Nematicidal Activity against Rice Parasitic Nematode Aphelenchoides besseyi.Int J Mol Sci. 2022 Jul 25;23(15):8189. doi: 10.3390/ijms23158189. Int J Mol Sci. 2022. PMID: 35897765 Free PMC article.
References
-
- Jones R (2009) Feynman's unfinished business. Nature nanotechnology 4: 785–785. - PubMed
-
- Djikanovic D, Kalauzi A, Jeremic M, Xu J, Micic M, et al. (2012) Interaction of the CdSe quantum dots with plant cell walls. Colloids Surf B Biointerfaces 91: 41–47. - PubMed
-
- Yang A, Zheng Y, Long C, Chen H, Liu B, et al. (2014) Fluorescent immunosorbent assay for the detection of alpha lactalbumin in dairy products with monoclonal antibody bioconjugated with CdSe/ZnS quantum dots. Food Chem 150: 73–79. - PubMed
-
- Sozer N, Kokini JL (2014) Use of quantum nanodot crystals as imaging probes for cereal proteins. Food Research International 57: 142–151.
Publication types
MeSH terms
Substances
LinkOut - more resources
Full Text Sources
Other Literature Sources
Medical
Miscellaneous
