

Carbon and nitrogen isotopes from top predator amino acids reveal rapidly shifting ocean biochemistry in the outer California Current
- PMID: 25329915
- PMCID: PMC4201512
- DOI: 10.1371/journal.pone.0110355
Carbon and nitrogen isotopes from top predator amino acids reveal rapidly shifting ocean biochemistry in the outer California Current
Abstract
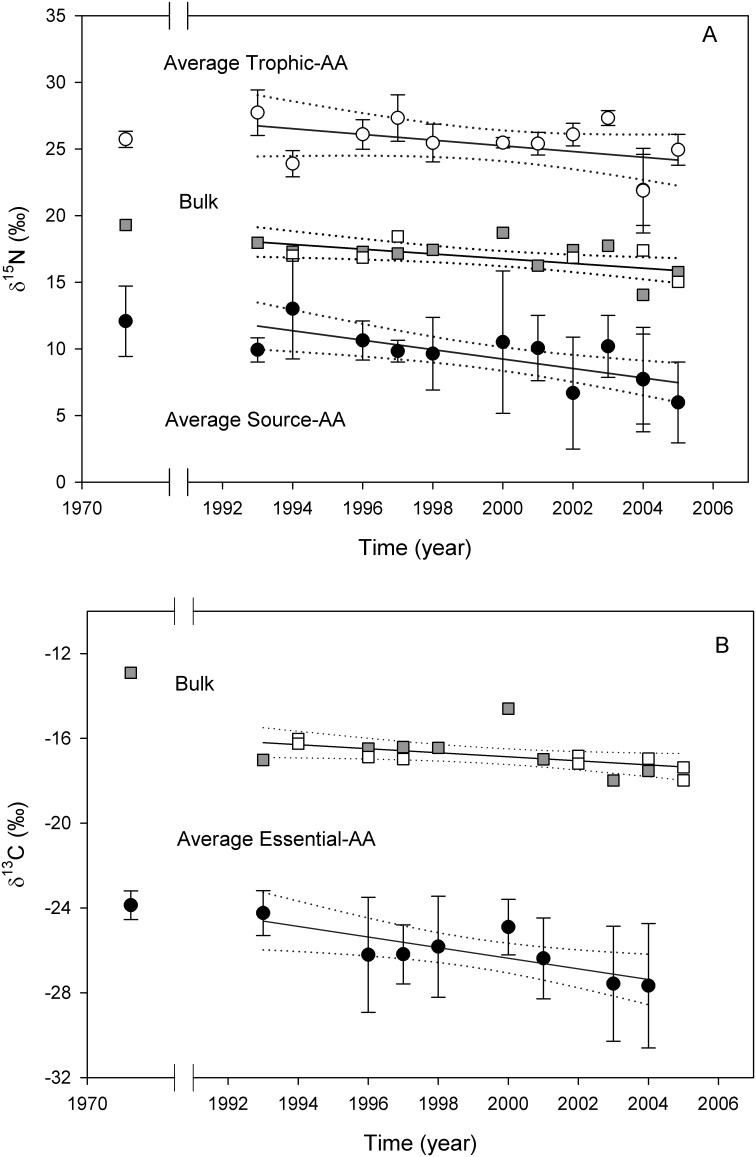
Climatic variation alters biochemical and ecological processes, but it is difficult both to quantify the magnitude of such changes, and to differentiate long-term shifts from inter-annual variability. Here, we simultaneously quantify decade-scale isotopic variability at the lowest and highest trophic positions in the offshore California Current System (CCS) by measuring δ15N and δ13C values of amino acids in a top predator, the sperm whale (Physeter macrocephalus). Using a time series of skin tissue samples as a biological archive, isotopic records from individual amino acids (AAs) can reveal the proximate factors driving a temporal decline we observed in bulk isotope values (a decline of ≥1 ‰) by decoupling changes in primary producer isotope values from those linked to the trophic position of this toothed whale. A continuous decline in baseline (i.e., primary producer) δ15N and δ13C values was observed from 1993 to 2005 (a decrease of ∼4‰ for δ15N source-AAs and 3‰ for δ13C essential-AAs), while the trophic position of whales was variable over time and it did not exhibit directional trends. The baseline δ15N and δ13C shifts suggest rapid ongoing changes in the carbon and nitrogen biogeochemical cycling in the offshore CCS, potentially occurring at faster rates than long-term shifts observed elsewhere in the Pacific. While the mechanisms forcing these biogeochemical shifts remain to be determined, our data suggest possible links to natural climate variability, and also corresponding shifts in surface nutrient availability. Our study demonstrates that isotopic analysis of individual amino acids from a top marine mammal predator can be a powerful new approach to reconstructing temporal variation in both biochemical cycling and trophic structure.
Conflict of interest statement
Figures


References
-
- Checkley JDM, Barth JA (2009) Patterns and processes in the California Current System. Prog Oceanogr 83: 49–64.
-
- Bograd SJ, William JS, Barlow J, Booth A, Brodeur RD, et al.. (2010) Status and trends of the California Current region, 2003–2008. PICES Special Publication. 106–141 p.
-
- McGowan JA, Bograd SJ, Lynn RJ, Miller AJ (2003) The biological response to the 1977 regime shift in the California Current. Deep Sea Res II 50: 2567–2582.
-
- Brinton E, Townsend A (2003) Decadal variability in abundances of the dominant euphausiid species in southern sectors of the California Current. Deep Sea Res II 50: 2449–2472.
-
- Chavez FP, Ryan J, Lluch-Cota SE, Ñiquen CM (2003) From anchovies to sardines and back: Multidecadal change in the Pacific Ocean. Science 299: 217–221. - PubMed
Publication types
MeSH terms
Substances
LinkOut - more resources
Full Text Sources
Other Literature Sources
