Clinical Trial
. 2014 Oct 20;9(10):e109434.
doi: 10.1371/journal.pone.0109434. eCollection 2014.

Dietary patterns differently associate with inflammation and gut microbiota in overweight and obese subjects

Affiliations
Clinical Trial

Dietary patterns differently associate with inflammation and gut microbiota in overweight and obese subjects

Ling Chun Kong et al. PLoS One. .

Abstract

Background: Associations between dietary patterns, metabolic and inflammatory markers and gut microbiota are yet to be elucidated.

Objectives: We aimed to characterize dietary patterns in overweight and obese subjects and evaluate the different dietary patterns in relation to metabolic and inflammatory variables as well as gut microbiota.

Design: Dietary patterns, plasma and adipose tissue markers, and gut microbiota were evaluated in a group of 45 overweight and obese subjects (6 men and 39 women). A group of 14 lean subjects were also evaluated as a reference group.

Results: Three clusters of dietary patterns were identified in overweight/obese subjects. Cluster 1 had the least healthy eating behavior (highest consumption of potatoes, confectionary and sugary drinks, and the lowest consumption of fruits that was associated also with low consumption of yogurt, and water). This dietary pattern was associated with the highest LDL cholesterol, plasma soluble CD14 (p = 0.01) a marker of systemic inflammation but the lowest accumulation of CD163+ macrophages with anti-inflammatory profile in adipose tissue (p = 0.05). Cluster 3 had the healthiest eating behavior (lower consumption of confectionary and sugary drinks, and highest consumption of fruits but also yogurts and soups). Subjects in this Cluster had the lowest inflammatory markers (sCD14) and the highest anti-inflammatory adipose tissue CD163+ macrophages. Dietary intakes, insulin sensitivity and some inflammatory markers (plasma IL6) in Cluster 3 were close to those of lean subjects. Cluster 2 was in-between clusters 1 and 3 in terms of healthfulness. The 7 gut microbiota groups measured by qPCR were similar across the clusters. However, the healthiest dietary cluster had the highest microbial gene richness, as evaluated by quantitative metagenomics.

Conclusion: A healthier dietary pattern was associated with lower inflammatory markers as well as greater gut microbiota richness in overweight and obese subjects.

Trial registration: ClinicalTrials.gov NCT01314690.


Conflict of interest statement

Competing Interests: KOT-Ceprodi Laboratory provided funding towards this study. BH and NG were employees of Danone Research at the time that this work was conducted. FHR and RB were contracted to work on behalf of Danone Research at the time that this work was conducted. LCK received a grant from Danone Research to undertake this work as part of a PhD program. There are no patents, products in development, or marketed products to declare. This does not alter the authors’ adherence to all the PLOS ONE policies on sharing data and materials.

Figures

Figure 1
Figure 1. Consort Flowchart.
Figure 2
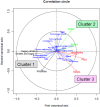
Figure 2. Canonical analysis: graphical representation of the food categories by cluster.
A graphical representation of the food categories that created the distinction between the clusters i.e. those which were strongly correlated with canonical axis (Can) or significantly different between clusters (KW test with Bonferroni correction). The can 1 axis separates Cluster1 from 2 or 3, the can 2 axis separates Cluster 2 from 1 or 3. If the food category is strongly correlated with the two canonical axes it separates the three clusters at the same time. Food categories shown in black characterise Cluster 1, in green characterise Cluster 2, and in red characterise Cluster 3. The projection of each food or drink category on each canonical axis represents the contribution of this category to the building of this canonical axis. Therefore, if a category has a high contribution to the first axis (e.g. fruit), it discriminates Cluster 1 from Cluster 2 or Cluster 3. The food categories with weak contribution (below 0.5 in the inner circle) are shown in blue. These categories do not contribute to the discrimination/characterization of the three clusters. The distance between the centre point of the figure and the food category represents the correlation to the canonical axis and therefore the contribution to the separation of clusters. Food categories close to the axis between Clusters 2 and 3 indicate that intakes are similar, as for yogurt. Food category names have been shorted in this figure for readability.
Figure 3
Figure 3. Differences of metabolic and inflammatory markers after stratified Kruskal-Wallis tests in the 3 dietary pattern clusters.
Black, grey and white columns represent the median values of the parameters in Cluster 1, Cluster 2 and Cluster 3, respectively, after age adjustment (see Methods S1 in Supporting Information S1). *: significant differences (p≤0.05) between the 3 clusters after stratified Kruskal-Wallis tests, #: a tendency of differences (0.05
Figure 4
Figure 4. Canonical correlation analysis for significant food categories and selected clinical parameters (all subjects).
Visualization of the association between the food categories that significantly distinguish one pattern from another and selected clinical parameters. Pairs of canonical axes were determined to maximize the covariance between the food categories and the clinical parameters. The canonical coefficients were used to assess the contributions of each food category and each clinical parameter to the correlation by evaluating their signs and magnitude. The healthy foods (yogurt, soups, fruits, vegetables) are in the area of CD163+ macrophages indicating the higher the consumption of these healthy foods, the higher the value for the alternatively (M2)-activated macrophages. The less healthy foods (potatoes, sweetened soft drinks, sweets) are in the area of LDL cholesterol, inflammatory parameters CD14, total fat mass and adipocyte diameter indicating that the higher the consumption of these foods, the higher the value of these clinical parameters; Food and clinical parameter arrows pointing in the same direction indicate positive correlation between them. The closer the food is to the clinical parameter, the greater the link (but in some cases this link is not strong, and the value for the correlation is less than 0.05).

References

    1. Schulze MB, Hoffmann K, Kroke A, Boeing H (2001) Dietary patterns and their association with food and nutrient intake in the European Prospective Investigation into Cancer and Nutrition (EPIC)-Potsdam study. Br J Nutr 85: 363–73. - PubMed
    1. Costacou T, Bamia C, Ferrari P, Riboli E, Trichopoulos D, et al. (2003) Tracing the Mediterranean diet through principal components and cluster analyses in the Greek population. Eur J Clin Nutr 57: 1378–85. - PubMed
    1. Kant AK (2004) Dietary patterns and health outcomes. J Am Diet Assoc 104: 615–35. - PubMed
    1. Newby PK, Weismayer C, Akesson A, Tucker KL, Wolk A (2006) Longitudinal changes in food patterns predict changes in weight and body mass index and the effects are greatest in obese women. J Nutr 136: 2580–7. - PubMed
    1. Schulze MB, Fung TT, Manson JE, Willett WC, Hu FB (2006) Dietary patterns and changes in body weight in women. Obesity (Silver Spring) 14: 1444–53. - PubMed

Publication types

MeSH terms

Associated data