. 2014 Oct 16;9(10):e110719.
doi: 10.1371/journal.pone.0110719. eCollection 2014.

Suppression of Foxo1 activity and down-modulation of CD62L (L-selectin) in HIV-1 infected resting CD4 T cells

Affiliations

Suppression of Foxo1 activity and down-modulation of CD62L (L-selectin) in HIV-1 infected resting CD4 T cells

Benjamin Trinité et al. PLoS One. .

Abstract

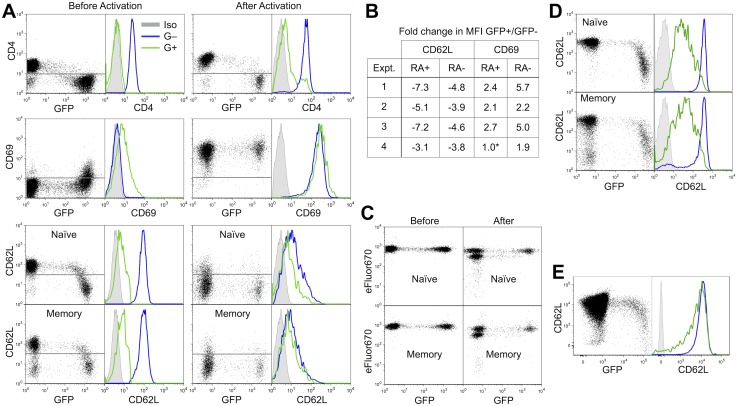
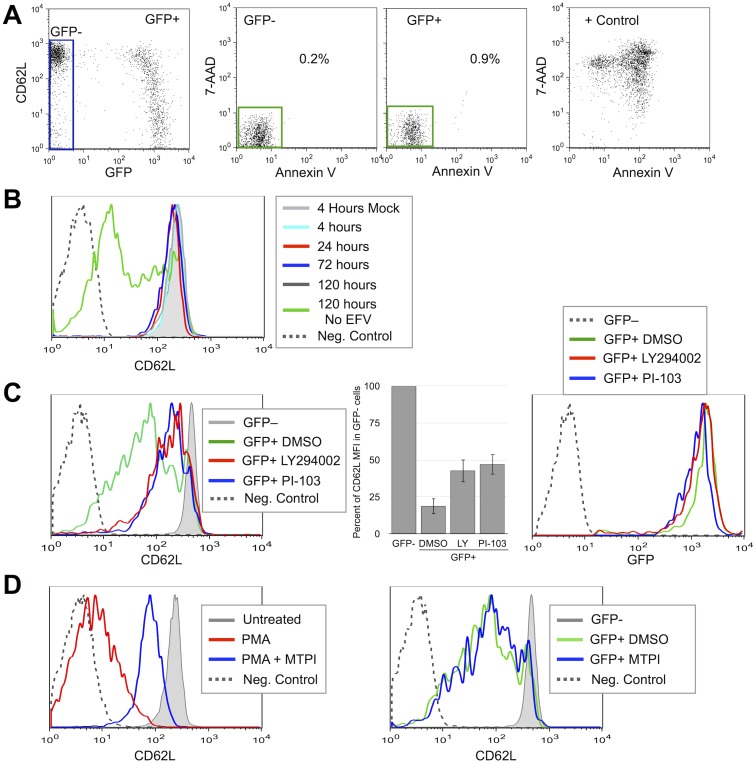
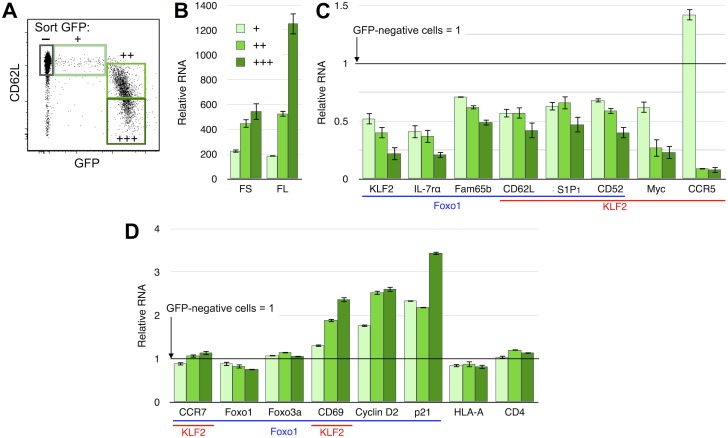
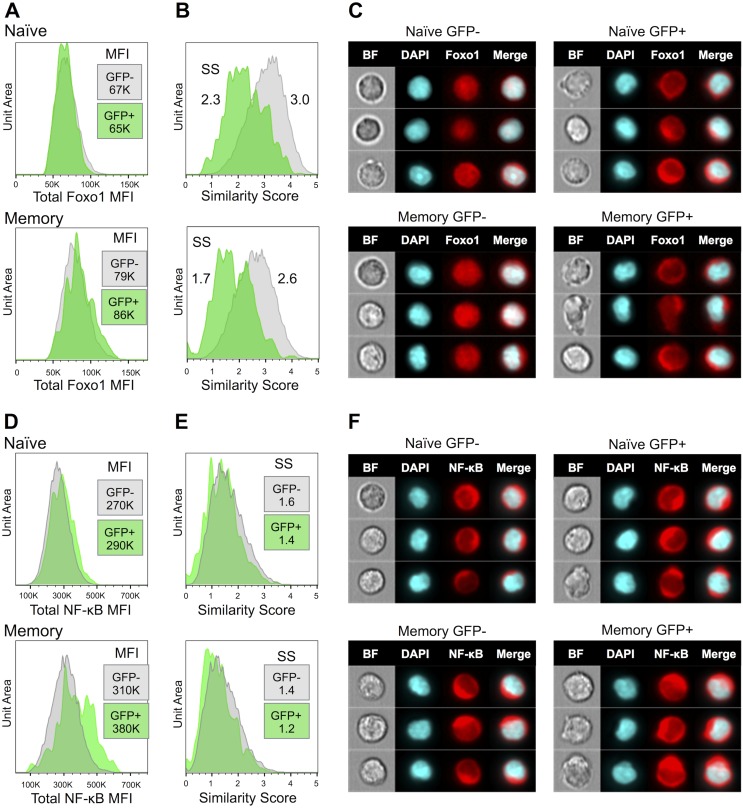
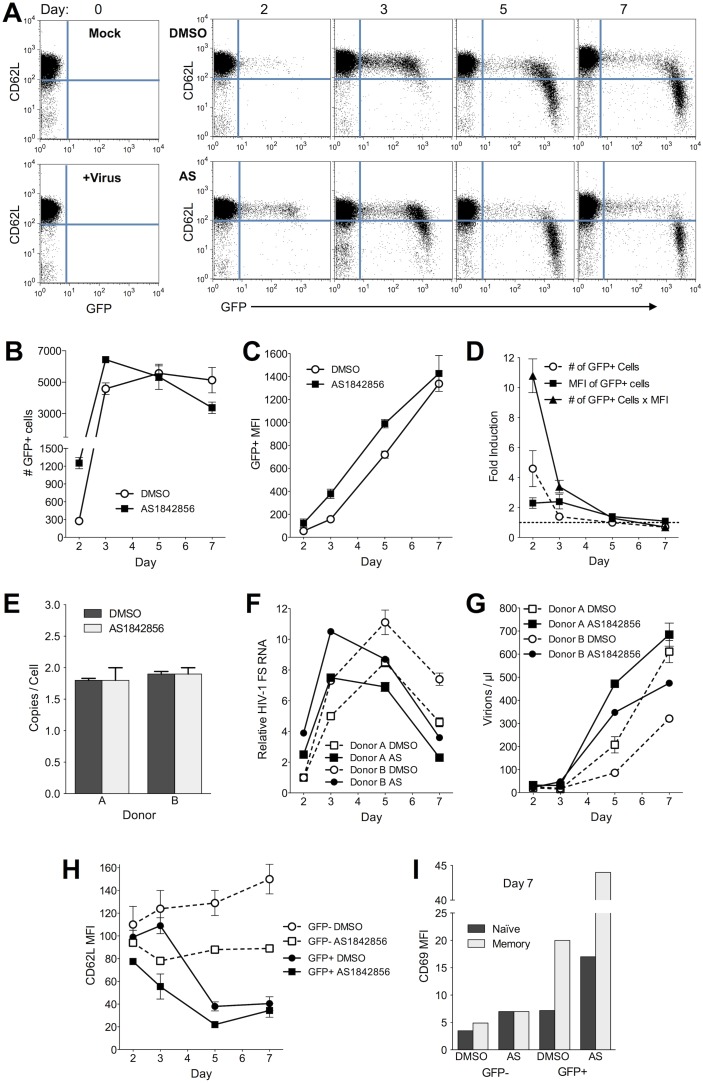
HIV-1 hijacks and disrupts many processes in the cells it infects in order to suppress antiviral immunity and to facilitate its replication. Resting CD4 T cells are important early targets of HIV-1 infection in which HIV-1 must overcome intrinsic barriers to viral replication. Although resting CD4 T cells are refractory to infection in vitro, local environmental factors within lymphoid and mucosal tissues such as cytokines facilitate viral replication while maintaining the resting state. These factors can be utilized in vitro to study HIV-1 replication in resting CD4 T cells. In vivo, the migration of resting naïve and central memory T cells into lymphoid tissues is dependent upon expression of CD62L (L-selectin), a receptor that is subsequently down-modulated following T cell activation. CD62L gene transcription is maintained in resting T cells by Foxo1 and KLF2, transcription factors that maintain T cell quiescence and which regulate additional cellular processes including survival, migration, and differentiation. Here we report that HIV-1 down-modulates CD62L in productively infected naïve and memory resting CD4 T cells while suppressing Foxo1 activity and the expression of KLF2 mRNA. Partial T cell activation was further evident as an increase in CD69 expression. Several other Foxo1- and KLF2-regulated mRNA were increased or decreased in productively infected CD4 T cells, including IL-7rα, Myc, CCR5, Fam65b, S1P1 (EDG1), CD52, Cyclin D2 and p21CIP1, indicating a profound reprogramming of these cells. The Foxo1 inhibitor AS1842856 accelerated de novo viral gene expression and the sequella of infection, supporting the notion that HIV-1 suppression of Foxo1 activity may be a strategy to promote replication in resting CD4 T cells. As Foxo1 is an investigative cancer therapy target, the development of Foxo1 interventions may assist the quest to specifically suppress or activate HIV-1 replication in vivo.


Conflict of interest statement

Competing Interests: The authors have declared that no competing interests exist.

Figures

Figure 1
Figure 1. Down-modulation of CD62L and upregulation of CD69 and on productively infected naïve and memory resting CD4 T cells.
A. Resting IL-7 treated CD4+ T cells were infected with the GFP reporter virus NLENG1, restricted to a single round of infection by treatment with the protease inhibitor indinavir (2 µM). Flow analysis was carried out on day 5 post infection on cells with and without activation by αCD3/CD28 beads on day 3 p.i. Grey: isotype-matched IgG control antibody staining. Blue: GFP-negative cells. Green: GFP+ cells. Data are representative of 4 independent experiments. B. Fold change in CD62L and CD69 expression on naïve and memory CD4+ resting T cells in A. With on exception (*) all values were statistically different (p<0.01) from the negative control by a T(x) population comparison test . C. Failure of GFP+ cells proliferate demonstrates that CD62L-low cells are not produced by preferential expansion of an existing CD62L-low population. Experiment shown is representative of >5 similar experiments. D. IL-4 supports HIV-1-induced down-modulation of CD62L on both naïve and memory resting CD4+ T cells. Experiment shown is representative of >3 similar experiments. E. CD62L down-modulation on HIV-1 infected naïve tonsil T cells 7 days after infection. Similar results were observed on CD45R0+cells (not shown). Experiment shown is representative of 2 similar experiments.
Figure 2
Figure 2. CD62L down-modulation is not the result of apoptosis, virus contact or protease cleavage, but is influenced by PI3K.
A. Cells infected with for 5 days, then were analyzed for GFP, CD62L and Annexin V surface expression, and permeability to 7-AAD. Data are representative of >5 independent experiments. B. Contact with HIV-1 virions does not affect CD62L surface expression. Cells were treated with the reverse transcriptase inhibitor efavirenz (EFV) (2 µg/ml) and infected by spinoculation or spinoculated without virus (Mock). Surface CD62L expression was analyzed at the indicated times after infection. A positive control infection was performed without EFV as indicated. EFV completely prevented the appearance of GFP+ cells (not shown). C. The PI3K and mTORC2 inhibitors LY294002 and PI-103 suppress HIV-1-induced CD62L down-modulation. Infected cells were treated with LY294002 (5 µM), PI-103 (5 µM) or a carrier control (DMSO) 1 day and again 4 hours prior to staining for CD62L. Middle graph: Data from 3 independent experiments with different cell donors. Y axis = the mean fluorescence intensity of CD62L staining (MFI) for each condition expressed as a percentage of the CD62L MFI of the GFP-negative cells. Right: GFP expression is modestly suppressed by LY294002 and PI-103 (MFI = 1761 and 1471 respectively, vs.1981 for DMSO control). LY294002 and PI-103 treatments were statistically different (p<0.01) from their respective DMSO controls by a T(x) population comparison test . D. Metalloprotease inhibitor (MTPI) TAPI-1 (50 µM) does not inhibit HIV-1-induced CD62L surface down-modulation. Left: Control experiment demonstrating inhibition of PMA-induced CD62L downmodulation by MTPI. Cells were treated with PMA with and without MTPI and analyzed one hour later. Right: Cells infected with HIV-1 GFP reporter virus were treated with MTPI 1 day and again 3 hours prior to staining. Data are representative of 2 independent experiments.
Figure 3
Figure 3. mRNA levels of several known Foxo1- and KLF2-regulated genes in HIV-1 infected naïve CD4+ T cells.
Data are representative of 3 independent experiments. Error bars represent SD of triplicate PCR reactions. A. CD45RO-CD4+ T cells were infected with sing-round GFP reporter virus for 7 days then sorted by FACS into 4 populations of GFP- and GFP+ cells according to GFP and CD62L expression. B. HIV-1 early fully spliced RNA (FS) and late full length RNA (FL) in each group of sorted cells. Data are normalized to a value of 1 for the FS RNA in GFP- cells. GFP- FL RNA was 1.5. A synthetic RNA standard containing both the FS and FL targets was used in order to allow the FS and FL values to be directly compared. Values are presented in Table S2 in File S1. C. mRNA of genes that were suppressed in GFP+ cells. Values are normalized to the GFP- cells set to a value of 1 for each gene. Genes regulated by Foxo1 or KLF2 are indicated by color-matched under lines. All p<0.01 (paired T-test). D. mRNA of genes that were changed <2 fold or were increased in GFP+ cells. mRNA in GFP-negative cells is set to a relative value of 1 for each gene as in C.
Figure 4
Figure 4. ImageStream analysis of Foxo1 and NF-κB in HIV-1 infected cells.
HIV-1 GFP-reporter virus-infected resting CD4+ T cells were stained for CD45RA, intracellular Foxo1 or NF-κB and for DNA (DAPI) 7 days after infection, then analyzed by ImageStream. One representative experiment of two is shown. A. Total Foxo1 expression in naïve and memory GFP+ and GFP- cells. MFI = Mean Fluorescence Intensity. B. Nuclear localization was analyzed in IDEAS software by comparison of Foxo1 distribution to nuclear DAPI staining using the Similarity Score (see materials and methods). C. Representative ImageStream pictures of individual cells stained for Foxo1. D. Total NF-κB expression in naïve and memory GFP+ and GFP- cells. E. NF-κB nuclear Similarity Scores. F. Representative ImageStream pictures of individual cells stained for NF-κB.
Figure 5
Figure 5. Foxo1 activity by TransAM ELISA.
A. Time course of Foxo1 inactivation following T cell activation with anti-CD3/CD28 beads. The ability of nuclear Foxo1 to bind a target DNA oligonucleotide was analyzed using a TransAM Foxo1 kit (Active Motif). SD of triplicate analysis of each condition are shown from one representative experiment of 3. Specificity was demonstrated by successful competition with a free Foxo1 binding oligonucleotide but not with a negative control oligonucleotide (not shown). Error bars are SD of triplicate wells. B. Foxo1 activity in HIV-1 infected resting CD4 T cells, mock infected and beads activated cells. Cells were infected with HIV-1 HSA reporter virus for 7 days, then separated into HSA+ and HSA-negative subsets using an antibody to HSA and magnetic beads. Data are from one representative experiment of three independent experiments. Error bars are SD of triplicate wells.
Figure 6
Figure 6. Foxo1 inhibitor AS1842856 accelerates HIV-1 expression.
AS1842856 (AS) was applied to cells 1 day before and 1 day after infection with single round GFP reporter virus. CD45RO- naïve T cells are shown. A. GFP and CD62L expression in infected naïve CD4+ T cells on the indicated day after infection. Donor A is shown. B. The number of GFP+ cells on the indicated day after infection. Data are average and SD of the two donors. C. Mean fluorescence intensity (MFI) of GFP in the GFP+ cells. Data are average and SD of the two donors. D. Fold increase in the number and the MFI of GFP+ cells, and total GFP fluorescence in the cells calculated as the product of the number of GFP+ cells multiplied by their MFI. Data are average and SD of the two donors. E. Near-full length reverse transcripts on day 2 after infection for one representative cell donor. Data are averages and SD for replicate PCR reactions for each donor. F. HIV-1 fully spliced RNA presented relative to day 1 DMSO condition. Data are averages and SD for replicate PCR reactions for each donor. G. Virus production measured by genomic RNA in culture medium. Data are averages and SD for replicate PCR reactions for each donor. H. CD62L MFI on the indicated day. Data are MFI of GFP+ cells divided by background staining. Data are average and SD of the two donors. I. CD69 MFI on day 7 post infection on naïve and memory resting CD4+ T cells for donor A.

Similar articles

Cited by

References

    1. Zhang ZQ, Wietgrefe SW, Li Q, Shore MD, Duan L, et al. (2004) Roles of substrate availability and infection of resting and activated CD4+ T cells in transmission and acute simian immunodeficiency virus infection. Proc Natl Acad Sci U S A 101: 5640–5645. - PMC - PubMed
    1. Ostrowski MA, Chun TW, Justement SJ, Motola I, Spinelli MA, et al. (1999) Both memory and CD45RA+/CD62L+ naive CD4(+) T cells are infected in human immunodeficiency virus type 1-infected individuals. J Virol 73: 6430–6435. - PMC - PubMed
    1. Zhang Z, Schuler T, Zupancic M, Wietgrefe S, Staskus KA, et al. (1999) Sexual transmission and propagation of SIV and HIV in resting and activated CD4+ T cells. Science 286: 1353–1357. - PubMed
    1. Schacker T, Little S, Connick E, Gebhard K, Zhang ZQ, et al. (2001) Productive infection of T cells in lymphoid tissues during primary and early human immunodeficiency virus infection. J Infect Dis 183: 555–562. - PubMed
    1. Li Q, Duan L, Estes JD, Ma ZM, Rourke T, et al. (2005) Peak SIV replication in resting memory CD4+ T cells depletes gut lamina propria CD4+ T cells. Nature 434: 1148–1152. - PubMed

Publication types

MeSH terms

Substances