. 2014 Oct 17;6(10):3837-54.
doi: 10.3390/v6103837.

A loop region in the N-terminal domain of Ebola virus VP40 is important in viral assembly, budding, and egress

Affiliations

A loop region in the N-terminal domain of Ebola virus VP40 is important in viral assembly, budding, and egress

Emmanuel Adu-Gyamfi et al. Viruses. .

Abstract

Ebola virus (EBOV) causes viral hemorrhagic fever in humans and can have clinical fatality rates of ~60%. The EBOV genome consists of negative sense RNA that encodes seven proteins including viral protein 40 (VP40). VP40 is the major Ebola virus matrix protein and regulates assembly and egress of infectious Ebola virus particles. It is well established that VP40 assembles on the inner leaflet of the plasma membrane of human cells to regulate viral budding where VP40 can produce virus like particles (VLPs) without other Ebola virus proteins present. The mechanistic details, however, of VP40 lipid-interactions and protein-protein interactions that are important for viral release remain to be elucidated. Here, we mutated a loop region in the N-terminal domain of VP40 (Lys127, Thr129, and Asn130) and find that mutations (K127A, T129A, and N130A) in this loop region reduce plasma membrane localization of VP40. Additionally, using total internal reflection fluorescence microscopy and number and brightness analysis we demonstrate these mutations greatly reduce VP40 oligomerization. Lastly, VLP assays demonstrate these mutations significantly reduce VLP release from cells. Taken together, these studies identify an important loop region in VP40 that may be essential to viral egress.


Figures

Figure 1
Figure 1
VP40 harbors a N-terminal and C-terminal domain. (A) VP40 (PDB ID: 4LDB) is a dimer mediated by a N-terminal domain (NTD) interface. The C-terminal domain (CTD) mediates membrane binding through a cationic patch and also creates an interface for VP40 oligomerization [13]. The NTD is shown in light gray and the CTD in dark gray. Residues found to be important in this study (Lys127, Thr129, and Asn130) for VP40 PM localization, oligomerization, and budding are shown in magenta. (B) VP40 sequence alignment from ebolaviruses and Marburg virus for the N-terminal loop region studied herein. Residues found to reduce PM localization, oligomerization, and VLP formation for EBOV VP40 are shown in bold.
Figure 2
Figure 2
Cellular localization of VP40 and mutations in HEK293 and CHOK-1 cells. (A) HEK293 cells were grown in an 8-well plate and transfected with WT VP40, K86A, K90A, K127A, T129A, and N130A DNA containing an EGFP fusion tag. Cells were imaged after 20 h using a Zeiss LSM 710 confocal microscope with a 63× 1.4 numerical aperture oil objective. Scale bar = 10 µm. (B) CHOK-1 cells were grown in an 8-well plate and transfected with WT VP40, K86A, K90A, K127A, T129A, and N130A DNA containing an EGFP fusion tag. Cells were imaged after 16 h using a Zeiss LSM 710 confocal microscope with a 63× 1.4 numerical aperture oil objective. Scale bar = 10 µm. (C) A histogram was plotted to demonstrate the percentage of HEK293 cells that displayed detectable PM localization for WT VP40 and mutations. Experiments were repeated in triplicate using at least 100 cells in each experiment to determine the S.D. as shown. One-way ANOVA analysis was used to calculate the standard error of the mean and p-value. ** p < 0.001.
Figure 3
Figure 3
Circular dichroism spectra of VP40 and mutants employed in this study. The spectra were taken on a JASCO 815 CD spectrometer scanned from 195–250 nm in a 1 mm quartz spectrophotometer cell. Each measurement was performed with 5 mg of indicated protein and was performed in triplicate to yield the mean representative scans. Molar ellipticity was defined according to the JASCO software [31] and was subtracted from a control buffer scan.
Figure 4
Figure 4
N&B Analysis of monomeric EGFP. (A) TIRF microscopy was used to image monomeric EGFP expressed in HEK293 cells; (B) Brightness versus intensity plot displaying monomers (red box); (C) Brightness distribution of EGFP near the PM displaying monomers (red) highlighted in B; (D) Frequency versus apparent brightness plot demonstrates a tightly correlated monomeric EGFP; (E) TIRF intensity image displaying monomeric EGFP distribution near the PM (blue = least intense; red = most intense); (F) Cellular brightness map of monomeric EGFP from the TIRF image (blue = least intense; red = most intense). Scale bar = 18 µm.
Figure 5
Figure 5
N&B Analysis of monomeric WT VP40. (A) TIRF microscopy was used to image EGFP-VP40 expressed in HEK293 cells elucidating extensive VP40 enriched PM protrusions; (B) Brightness versus intensity plot displaying monomers and dimers (red box), trimers and tetramers (blue box), and hexamers to octamers (green box); (C) Brightness distribution of EGFP at or on the PM displaying monomers and dimers (red), trimers and tetramers (blue), and hexamers to octamers (green) highlighted in B; (D) Frequency versus apparent brightness plot of EGFP-VP40 demonstrates significant oligomerization of VP40 at or near the PM of HEK293 cells; (E) TIRF intensity image displaying EGFP-VP40 distribution at or near the PM (blue = least intense; red = most intense). VP40 oligomers are enriched in the cellular protrusions; (F) Cellular brightness map of EGFP-VP40 from the TIRF image demonstrates the exclusive localization of VP40 oligomers to membrane protrusion sites (blue = least intense; red = most intense); (G) Histogram plot of the ratio of VP40 oligomers/VP40 (monomers+dimers) to demonstrate the reduction of PM oligomerization of K127A and N130A is statistically significant. One-way ANOVA analysis was used to calculate the standard error of the mean and p-value. ** p < 0.001. Scale bar = 18 µm.
Figure 6
Figure 6
N&B Analysis of K127A. (A) TIRF microscopy was used to image EGFP-VP40-K127A expressed in HEK293 cells elucidating VP40 enriched PM protrusions. (B) Brightness versus intensity plot displaying monomers and dimers (red box) and trimers and tetramers (blue box). Note that little to no hexamers are detected in the brightness versus intensity plot. (C) Brightness distribution of K127A at or on the PM displaying monomers or dimers (red) and trimers and tetramers (blue). (D) Frequency versus apparent brightness plot demonstrates significantly lower oligomerization of K127A (See Figure 5G also) at or near the PM of HEK293 cells. (E) TIRF intensity image displaying EGFP-VP40-K127A distribution at or near the PM (blue = least intense; red = most intense). VP40 oligomers are enriched in the cellular protrusions. (F) The cellular brightness map of EGFP-VP40-K127A from the TIRF image demonstrates the significant reduction in oligomerization compared to WT (blue = least intense; red = most intense). Scale bar = 18 µm.
Figure 7
Figure 7
N&B Analysis of N130A. (A) TIRF microscopy was used to image EGFP-VP40-N130A expressed in HEK293 cells elucidating a low level of N130A enriched PM protrusions. (B) Brightness versus intensity plot displaying monomers and dimers (red box) and trimers and tetramers (blue box). Note that little to no hexamers were detected in the brightness versus intensity plot. (C) Brightness distribution of N130A at or on the PM displaying monomers and dimers (red) or trimers and tetramers (blue). (D) Frequency versus apparent brightness plot demonstrates significantly lower oligomerization of N130A at or near the PM of HEK293 cells. (E) TIRF intensity image displaying EGFP-VP40-N130A distribution at or near the PM (blue = least intense; red = most intense). N130A enrichment at the PM and protrusion sites is greatly reduced compared to WT VP40 and even K127A (See Figure 5G). (F) Despite the presence of intense punctae of N130A at the PM, the cellular brightness map of EGFP-VP40-N130A from the TIRF image demonstrates the significant reduction in oligomerization or PM protrusions compared to WT and K127A (blue = least intense; red = most intense) (See Figure 5G). Scale bar = 18 µm.
Figure 8
Figure 8
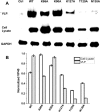
VLP analysis of VP40 and respective mutations. CHOK-1 cells were transfected with plasmid DNA encoding either empty EGFP plasmid (control) or WT VP40, K86A, K90A, K127A, T129A, or N130A EGFP fusion constructs. (A) The cell lysate and VLPs were collected after 48 h as described previously [14,17,21] and subjected to Western blot with anti-EGFP. The ratio of cell lysate to VLPs was maintained for each sample with GAPDH used as a loading control for total cellular density. (B) Image J was used to quantify band density for each sample repeated in triplicate in order to determine the standard deviation. The band densities were first normalized to the GAPDH loading control and then normalized with respect to VP40 cell lysate band density. The normalized average band intensity is shown for cell lysate VP40 and VLP VP40 for each construct.
Figure 9
Figure 9
The Lys127, Thr129, Asn130 N-terminal loop region is on the same interface as a C-terminal residue sequence previously identified to be important for VP40 budding. Lys127, Thr129, Asn130 (magenta) in the NTD (PDB ID: 4LDB) are adjacent and on the same interface as a CTD sequence (Lys212, Leu213, and Arg214 in cyan) previously shown to be important to VP40 PM localization and budding.

Similar articles

Cited by

References

    1. Feldmann H. Ebola—A growing threat? N. Engl. J. Med. 2014;371:1375–1378. - PubMed
    1. Brauburger K., Hume A.J., Muhlberger E., Olejnik J. Forty-five years of Marburg virus research. Viruses. 2012;4:1878–1927. doi: 10.3390/v4101878. - DOI - PMC - PubMed
    1. Lee J.E., Fusco M.L., Hessell A.J., Oswald W.B., Burton D.R., Saphire E.O. Structure of the Ebola virus glycoprotein bound to an antibody from a human survivor. Nature. 2008;454:177–182. doi: 10.1038/nature07082. - DOI - PMC - PubMed
    1. Carette J.E., Raaben M., Wong A.C., Herbert A.S., Obernosterer G., Mulherkar N., Kuehne A.I., Kranzusch P.J., Griffin A.M., Ruthel G., et al. Ebola virus entry requires the cholesterol transporter niemann-pick c1. Nature. 2011;477:340–343. doi: 10.1038/nature10348. - DOI - PMC - PubMed
    1. Cote M., Misasi J., Ren T., Bruchez A., Lee K., Filone C.M., Hensley L., Li Q., Ory D., Chandran K., et al. Small molecule inhibitors reveal niemann-pick c1 is essential for Ebola virus infection. Nature. 2011;477:344–348. doi: 10.1038/nature10380. - DOI - PMC - PubMed

Publication types