. 2014 Oct 16;9(10):e110003.
doi: 10.1371/journal.pone.0110003. eCollection 2014.

Induction of apoptosis and antiproliferative activity of naringenin in human epidermoid carcinoma cell through ROS generation and cell cycle arrest

Affiliations

Induction of apoptosis and antiproliferative activity of naringenin in human epidermoid carcinoma cell through ROS generation and cell cycle arrest

Md Sultan Ahamad et al. PLoS One. .

Abstract

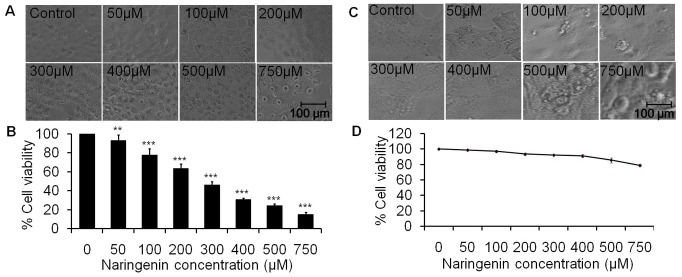
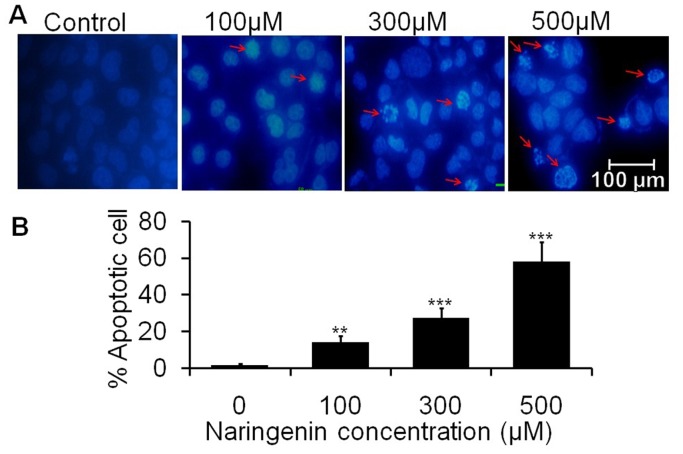
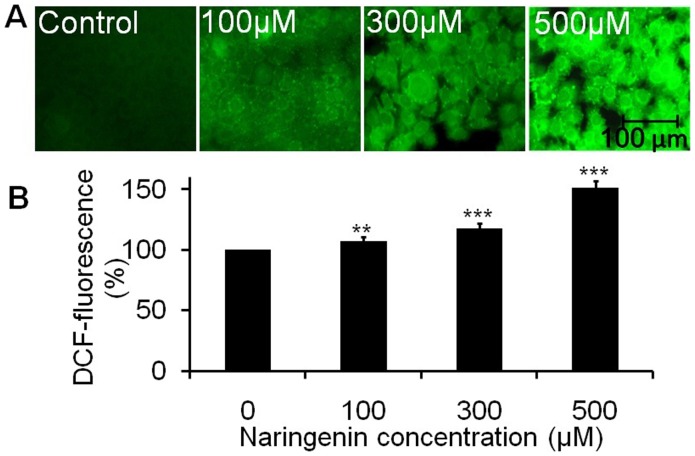
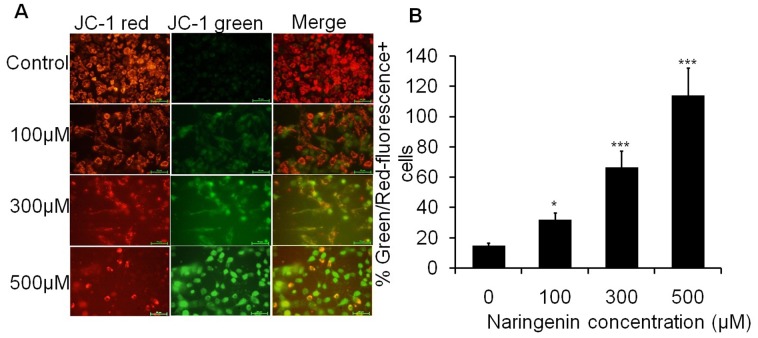
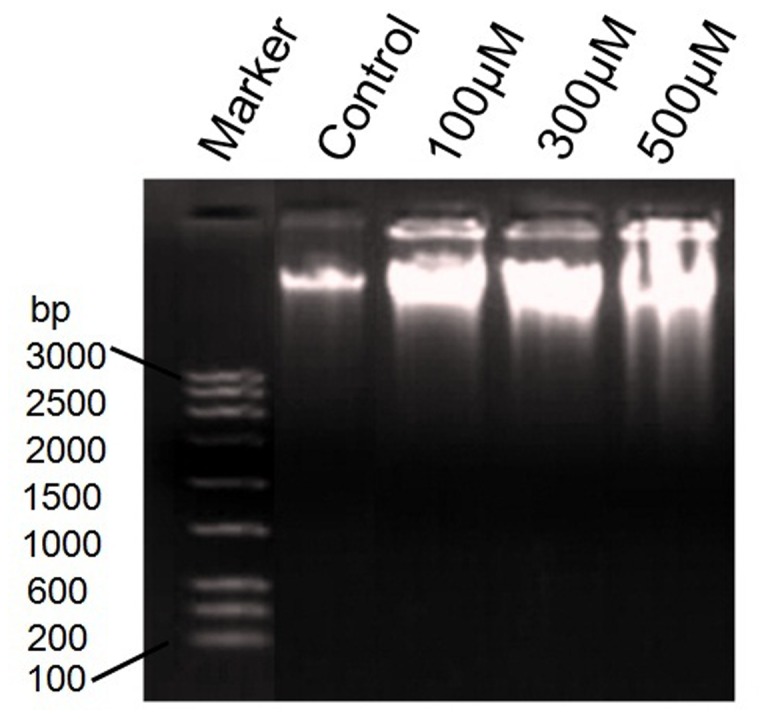
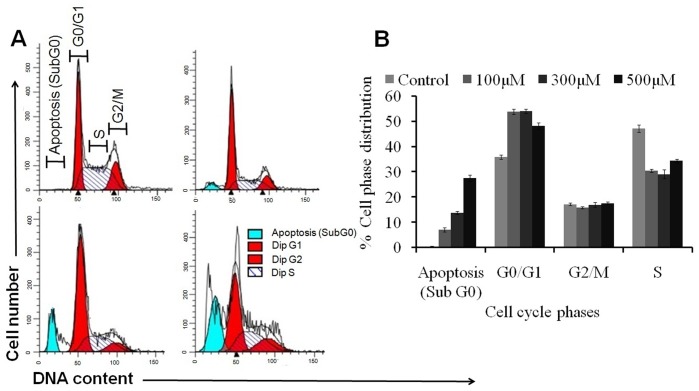
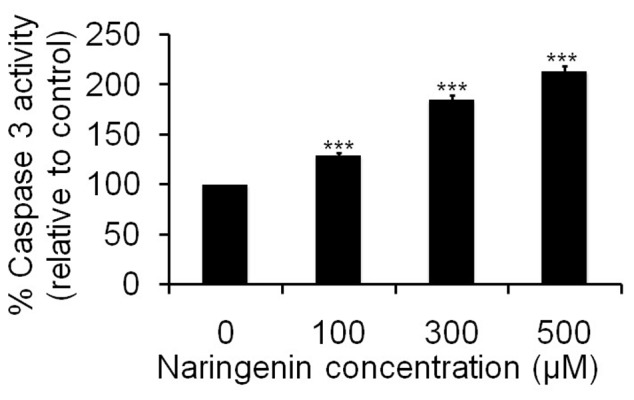
A natural predominant flavanone naringenin, especially abundant in citrus fruits, has a wide range of pharmacological activities. The search for antiproliferative agents that reduce skin carcinoma is a task of great importance. The objective of this study was to analyze the anti-proliferative and apoptotic mechanism of naringenin using MTT assay, DNA fragmentation, nuclear condensation, change in mitochondrial membrane potential, cell cycle kinetics and caspase-3 as biomarkers and to investigate the ability to induce reactive oxygen species (ROS) initiating apoptotic cascade in human epidermoid carcinoma A431 cells. Results showed that naringenin exposure significantly reduced the cell viability of A431 cells (p<0.01) with a concomitant increase in nuclear condensation and DNA fragmentation in a dose dependent manner. The intracellular ROS generation assay showed statistically significant (p<0.001) dose-related increment in ROS production for naringenin. It also caused naringenin-mediated epidermoid carcinoma apoptosis by inducing mitochondrial depolarization. Cell cycle study showed that naringenin induced cell cycle arrest in G0/G1 phase of cell cycle and caspase-3 analysis revealed a dose dependent increment in caspase-3 activity which led to cell apoptosis. This study confirms the efficacy of naringenin that lead to cell death in epidermoid carcinoma cells via inducing ROS generation, mitochondrial depolarization, nuclear condensation, DNA fragmentation, cell cycle arrest in G0/G1 phase and caspase-3 activation.


Conflict of interest statement

Competing Interests: The authors have declared that no competing interests exist.

Figures

Figure 1
Figure 1. In vitro activity of naringenin against Human skin carcinoma A431 and normal HaCat cells.
(A) Morphological view of live and dead cells of A431 cell line treated with 50 µM to 750 µM concentration of naringenin (B) The percent cell viability of A431 cells measured by a MTT assay at 24 h as described in the experimental section. (C) Morphological analysis of normal HaCat cell line treated with 50 µM to 750 µM concentration of naringenin. Photomicrographs were taken by inverted phase contrast microscope. (D) The percent cell viability of HaCat cell measured by a MTT assay at 24 h. Values are expressed as means ± SD of at least three independent experiments, **p<0.01 and ***p<0.001 as compared with their respective control.
Figure 2
Figure 2. Chromatin condensation of A431 cells stained with DAPI after naringenin treatment.
Cells were treated with 100 µM, 300 µM and 500 µM of naringenin. (A) Photomicrographs were taken by florescence phase contrast microscope that showed fragmented and condensed nuclei as indicated by arrow (B) Numerical data were expressed as % apoptotic cells respective to their control. Data is representative of three independent experiments and expressed as means ± SD, **p<0.01 and ***p<0.001 as compared with their respective control.
Figure 3
Figure 3. Photomicrographs showing intracellular ROS generation in A431 cells induced by naringenin and stained with DCFH-DA.
(A) Photomicrographs showing intracellular ROS generation induced by 100 µM, 300 µM and 500 µM of naringenin after 12 h incubation. Photomicrographs were taken by florescence phase contrast microscope (B) Values are expressed as the percentage of fluorescence intensity relative to the control. Values are expressed as means ± SD of at least three independent experiments, **p<0.01 and **p<0.001 as compared with their respective control.
Figure 4
Figure 4. Fluorescence image of A431 cells stained with JC-1 after 24 h incubation with different concentrations of naringenin.
(A) Photograph showing JC-1 red, JC-1 green and merge image. The JC-1 green fluorescence indicates a decrease in mitochondrial membrane potential, an early event in apoptosis. Increased concentrations of naringenin attenuated the loss of mitochondrial membrane potential. (B) Numerical data were expressed as % Green/Red fluorescence+ cells which were increased with increasing doses of naringenin. Data is representative of three independent experiments and expressed as means ± SD, *p<0.05, **p<0.01 and ***p<0.001 as compared with their respective control.
Figure 5
Figure 5. DNA fragmentation analysis.
DNA fragmentation of A431cell treated with 100 µM, 200 µM and 300 µM of naringenin. 1st well showing the 3 kb DNA marker. DNA laddering pattern showed that naringenin induces DNA fragmentation in a dose dependent manner.
Figure 6
Figure 6. Effect of naringenin on different phases of cell cycle.
A431 cells were treated with different concentrations of naringenin (100 µM−300 µM) for 24 h, stained with propidium iodide and measured by flow cytometry (A) Representative photomicrograph showing the apoptosis and phase distribution of cell population (B) Quantitative distribution of percentage of A431 cells in different phases of cell cycle treated with different concentrations of naringenin. Data is representative of three independent experiments.
Figure 7
Figure 7. Activation of caspase 3 by naringenin against human skin carcinoma A431 cells.
Cells were incubated with naringenion at 100 µM, 300 µM and 500 µM for 24 h. Values are expressed as means ± SD of at least three independent experiments, **p<0.01 and ***p<0.001 as compared with their respective control.

References

    1. Hengartner MO (2000) The biochemistry of apoptosis. Nature 407: 770–776. - PubMed
    1. Evan GI, Vousden KH (2001) Proliferation, cell cycle and apoptosis in cancer. Nature 411: 342–348. - PubMed
    1. Ashkenazi A, Dixit VM (1998) Death receptors: signaling and modulation. Science 281: 1305–1308. - PubMed
    1. Fulda S, Debatin KM (2006) Extrinsic versus intrinsic apoptosis pathways in anticancer chemotherapy. Oncogene 25: 4798–4811. - PubMed
    1. Green DR, Kroemer G (2004) The pathophysiology of mitochondrial cell death. Science 305: 626–629. - PubMed

Publication types

MeSH terms