

Prospect theory for online financial trading
- PMID: 25330203
- PMCID: PMC4198126
- DOI: 10.1371/journal.pone.0109458
Prospect theory for online financial trading
Abstract
Prospect theory is widely viewed as the best available descriptive model of how people evaluate risk in experimental settings. According to prospect theory, people are typically risk-averse with respect to gains and risk-seeking with respect to losses, known as the "reflection effect". People are much more sensitive to losses than to gains of the same magnitude, a phenomenon called "loss aversion". Despite of the fact that prospect theory has been well developed in behavioral economics at the theoretical level, there exist very few large-scale empirical studies and most of the previous studies have been undertaken with micro-panel data. Here we analyze over 28.5 million trades made by 81.3 thousand traders of an online financial trading community over 28 months, aiming to explore the large-scale empirical aspect of prospect theory. By analyzing and comparing the behavior of winning and losing trades and traders, we find clear evidence of the reflection effect and the loss aversion phenomenon, which are essential in prospect theory. This work hence demonstrates an unprecedented large-scale empirical evidence of prospect theory, which has immediate implication in financial trading, e.g., developing new trading strategies by minimizing the impact of the reflection effect and the loss aversion phenomenon. Moreover, we introduce three novel behavioral metrics to differentiate winning and losing traders based on their historical trading behavior. This offers us potential opportunities to augment online social trading where traders are allowed to watch and follow the trading activities of others, by predicting potential winners based on their historical trading behavior.
Conflict of interest statement
Figures

 . Here error bars mean the standard error of the mean (SEM). (c) Mean ROI of positive trades. Mirror trade has the lowest
  for positive trades. (d) Mean ROI of negative trades. Mirror trade has the highest negative
  for negative trades.
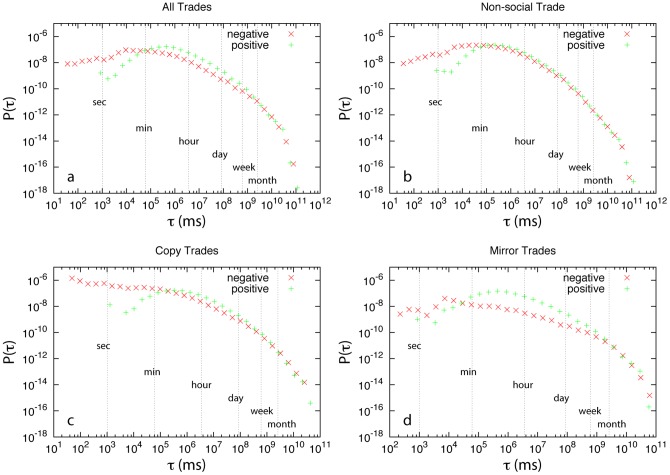
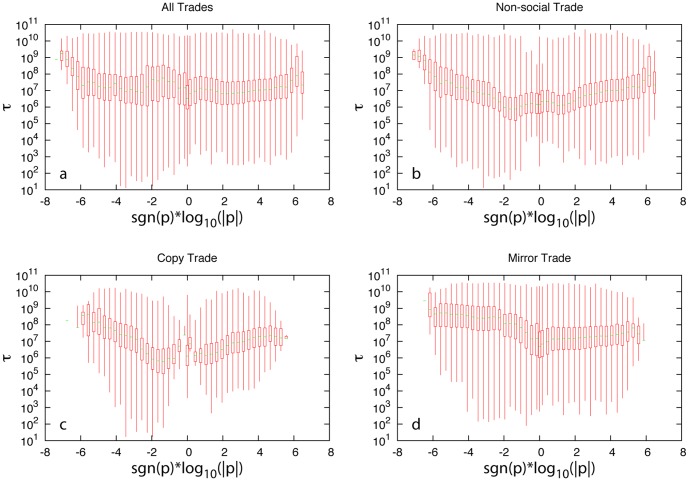
 of different trade types in logarithmic bins. (If
  , we bin it using
  .) For the trades contained in each bin, we draw the box-and-whisker plot for their duration (
 ), representing the minimum, first quartile, median, third quartiles, and maximum of the data in the bin. (a) All trades. (b) Non-social trades. (c) Copy trades. (d) Mirror trades.
 ).
).  and
and  are the profit of winning positions and the loss of losing positions, respectively, of traders. (c, d) Distribution of win-loss waiting time ratio (
 ). Here
  and
and  are the average duration time of winning and losing positions, respectively, of traders. (e, f) Distribution of win-loss ROI ratio (
 ).
).  and
and  are the ROI of winning and losing positions, respectively, of traders. (g, h) Distribution of winning percentage (
 ) of traders.
  and
and  are the number of winning and losing positions, respectively, of traders.
References
-
- Moat HS, Curme C, Avakian A, Kenett DY, Stanley HE, et al. (2013) Quantifying wikipedia usage patterns before stock market moves. Sci Rep 3: 1801.
Publication types
MeSH terms
LinkOut - more resources
Full Text Sources
Other Literature Sources
