

Biogeochemical typing of paddy field by a data-driven approach revealing sub-systems within a complex environment--a pipeline to filtrate, organize and frame massive dataset from multi-omics analyses
- PMID: 25330259
- PMCID: PMC4203823
- DOI: 10.1371/journal.pone.0110723
Biogeochemical typing of paddy field by a data-driven approach revealing sub-systems within a complex environment--a pipeline to filtrate, organize and frame massive dataset from multi-omics analyses
Abstract
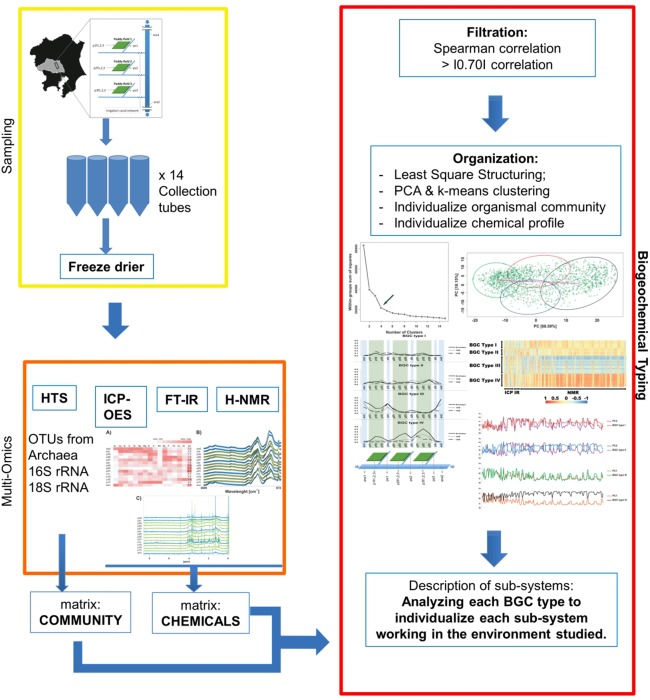
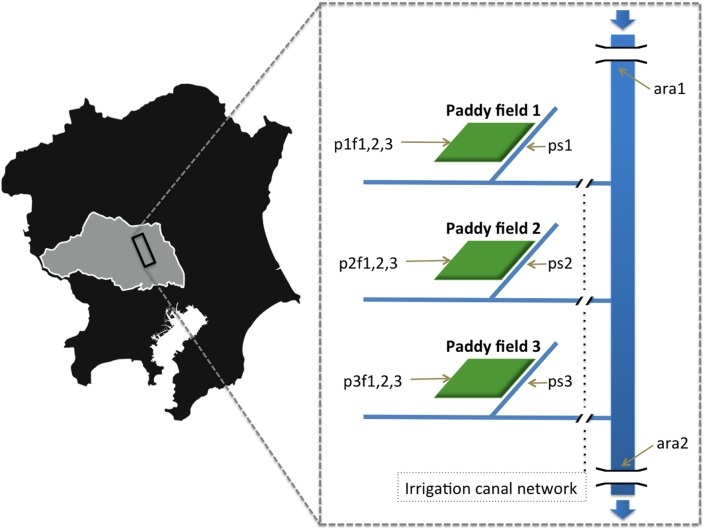
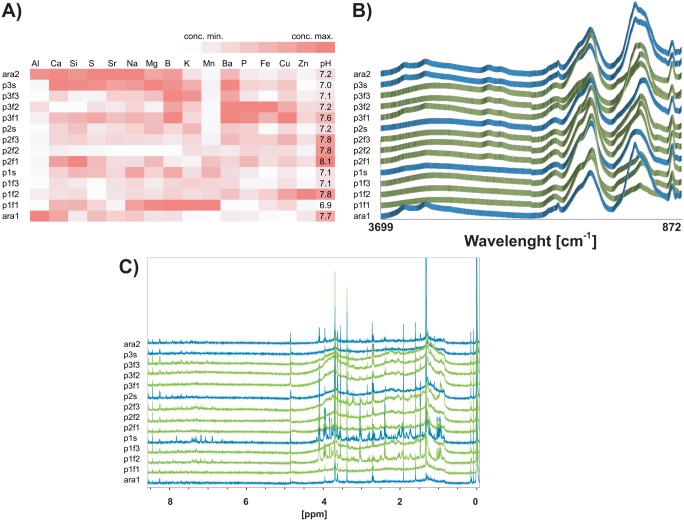
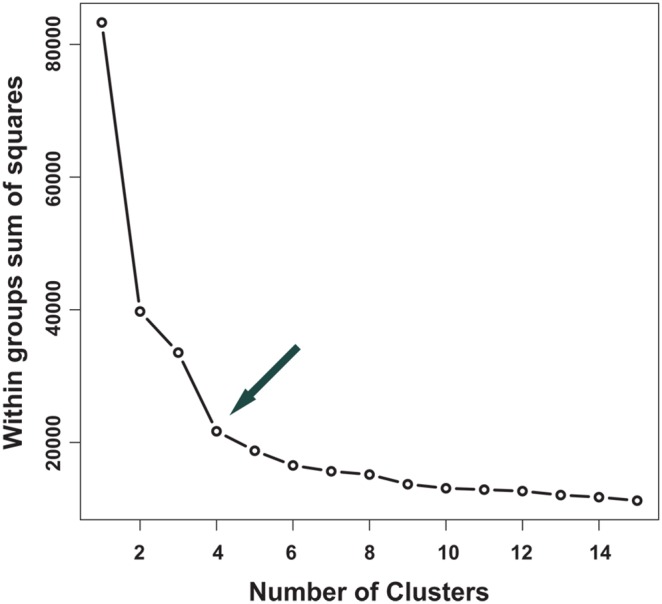
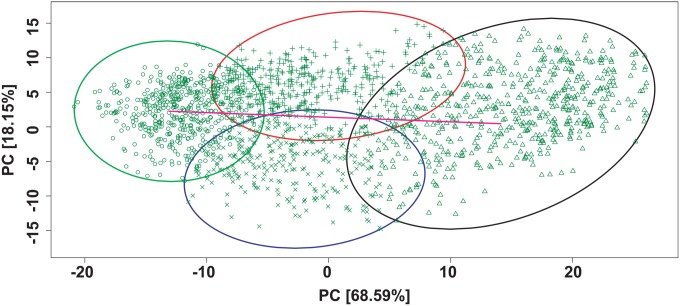
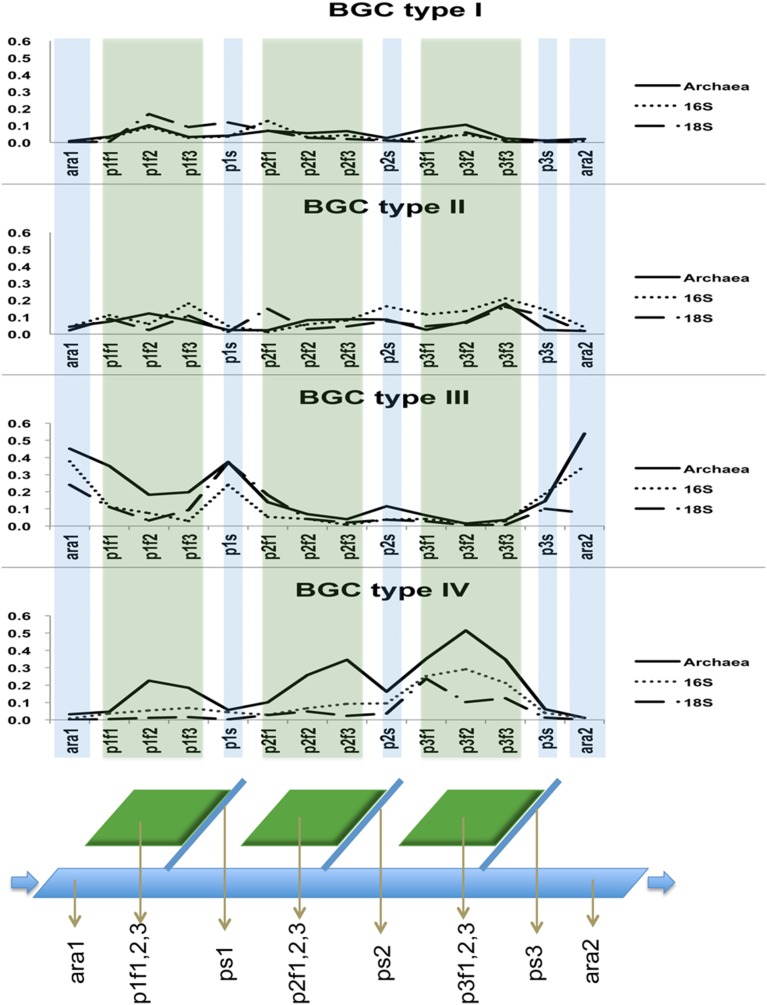
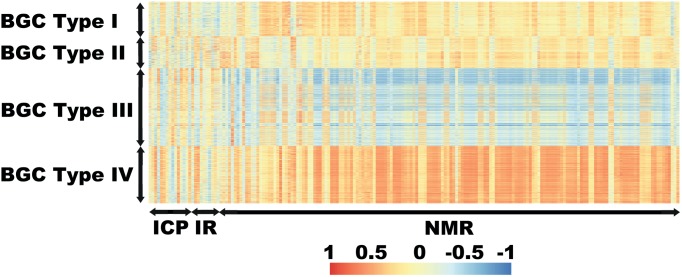
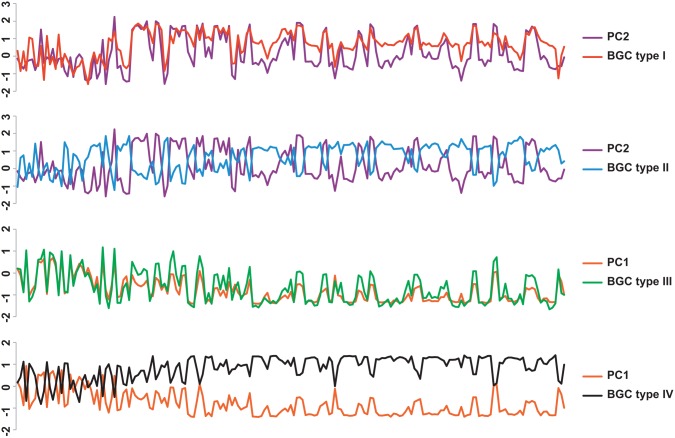
We propose the technique of biogeochemical typing (BGC typing) as a novel methodology to set forth the sub-systems of organismal communities associated to the correlated chemical profiles working within a larger complex environment. Given the intricate characteristic of both organismal and chemical consortia inherent to the nature, many environmental studies employ the holistic approach of multi-omics analyses undermining as much information as possible. Due to the massive amount of data produced applying multi-omics analyses, the results are hard to visualize and to process. The BGC typing analysis is a pipeline built using integrative statistical analysis that can treat such huge datasets filtering, organizing and framing the information based on the strength of the various mutual trends of the organismal and chemical fluctuations occurring simultaneously in the environment. To test our technique of BGC typing, we choose a rich environment abounding in chemical nutrients and organismal diversity: the surficial freshwater from Japanese paddy fields and surrounding waters. To identify the community consortia profile we employed metagenomics as high throughput sequencing (HTS) for the fragments amplified from Archaea rRNA, universal 16S rRNA and 18S rRNA; to assess the elemental content we employed ionomics by inductively coupled plasma optical emission spectroscopy (ICP-OES); and for the organic chemical profile, metabolomics employing both Fourier transformed infrared (FT-IR) spectroscopy and proton nuclear magnetic resonance (1H-NMR) all these analyses comprised our multi-omics dataset. The similar trends between the community consortia against the chemical profiles were connected through correlation. The result was then filtered, organized and framed according to correlation strengths and peculiarities. The output gave us four BGC types displaying uniqueness in community and chemical distribution, diversity and richness. We conclude therefore that the BGC typing is a successful technique for elucidating the sub-systems of organismal communities with associated chemical profiles in complex ecosystems.
Conflict of interest statement
Figures
Similar articles
-
Practical considerations for sampling and data analysis in contemporary metagenomics-based environmental studies.J Microbiol Methods. 2018 Nov;154:14-18. doi: 10.1016/j.mimet.2018.09.020. Epub 2018 Oct 1. J Microbiol Methods. 2018. PMID: 30287354 Review.
-
PanFP: pangenome-based functional profiles for microbial communities.BMC Res Notes. 2015 Sep 26;8:479. doi: 10.1186/s13104-015-1462-8. BMC Res Notes. 2015. PMID: 26409790 Free PMC article.
-
From Sample to Multi-Omics Conclusions in under 48 Hours.mSystems. 2016 Apr 26;1(2):e00038-16. doi: 10.1128/mSystems.00038-16. eCollection 2016 Mar-Apr. mSystems. 2016. PMID: 27822524 Free PMC article.
-
Genomic evidence for sulfur intermediates as new biogeochemical hubs in a model aquatic microbial ecosystem.Microbiome. 2021 Feb 16;9(1):46. doi: 10.1186/s40168-021-00999-x. Microbiome. 2021. PMID: 33593438 Free PMC article.
-
The multi-omics promise in context: from sequence to microbial isolate.Crit Rev Microbiol. 2018 Mar;44(2):212-229. doi: 10.1080/1040841X.2017.1332003. Epub 2017 May 31. Crit Rev Microbiol. 2018. PMID: 28562180 Review.
Cited by
-
Improvement of physical, chemical, and biological properties of aridisol from Botswana by the incorporation of torrefied biomass.Sci Rep. 2016 Jun 17;6:28011. doi: 10.1038/srep28011. Sci Rep. 2016. PMID: 27313139 Free PMC article.
-
Application of kernel principal component analysis and computational machine learning to exploration of metabolites strongly associated with diet.Sci Rep. 2018 Feb 21;8(1):3426. doi: 10.1038/s41598-018-20121-w. Sci Rep. 2018. PMID: 29467421 Free PMC article.
-
Identification of Reliable Components in Multivariate Curve Resolution-Alternating Least Squares (MCR-ALS): a Data-Driven Approach across Metabolic Processes.Sci Rep. 2015 Nov 4;5:15710. doi: 10.1038/srep15710. Sci Rep. 2015. PMID: 26531245 Free PMC article.
-
Visualization of Microfloral Metabolism for Marine Waste Recycling.Metabolites. 2016 Jan 27;6(1):7. doi: 10.3390/metabo6010007. Metabolites. 2016. PMID: 26828528 Free PMC article.
-
Evaluation of 16S rRNA Gene Primer Pairs for Monitoring Microbial Community Structures Showed High Reproducibility within and Low Comparability between Datasets Generated with Multiple Archaeal and Bacterial Primer Pairs.Front Microbiol. 2016 Aug 23;7:1297. doi: 10.3389/fmicb.2016.01297. eCollection 2016. Front Microbiol. 2016. PMID: 27602022 Free PMC article.
References
-
- Asakura T, Date Y, Kikuchi J (2014) Comparative analysis of chemical and microbial profiles in estuarine sediments sampled from Kanto and Tohoku regions in Japan. Anal Chem 86: 5425–5432. - PubMed
-
- Joyce AR, Palsson B (2006) The model organism as a system: integrating 'omics' data sets. Nat Rev Mol Cell Biol 7: 198–210. - PubMed
-
- Castell WZ, Ernst D (2012) Experimental 'omics' data in tree research: facing complexity. Trees-Structure and Function 26: 1723–1735.
Publication types
MeSH terms
LinkOut - more resources
Full Text Sources
Other Literature Sources
