. 2014 Oct 21:4:6701.
doi: 10.1038/srep06701.

A molecular fluorescent probe for targeted visualization of temperature at the endoplasmic reticulum

Affiliations

A molecular fluorescent probe for targeted visualization of temperature at the endoplasmic reticulum

Satoshi Arai et al. Sci Rep. .

Abstract

The dynamics of cellular heat production and propagation remains elusive at a subcellular level. Here we report the first small molecule fluorescent thermometer selectively targeting the endoplasmic reticulum (ER thermo yellow), with the highest sensitivity reported so far (3.9%/°C). Unlike nanoparticle thermometers, ER thermo yellow stains the target organelle evenly without the commonly encountered problem of aggregation, and successfully demonstrates the ability to monitor intracellular temperature gradients generated by external heat sources in various cell types. We further confirm the ability of ER thermo yellow to monitor heat production by intracellular Ca(2+) changes in HeLa cells. Our thermometer anchored at nearly-zero distance from the ER, i.e. the heat source, allowed the detection of the heat as it readily dissipated, and revealed the dynamics of heat production in real time at a subcellular level.


Figures

Figure 1
Figure 1. ER targetable fluorescent thermometer.
(a) Chemical structure of ER thermo yellow. (b) Co-localization of ER thermo yellow and ER tracker green. HeLa cells were stained with DAPI, ER tracker green, and ER thermo yellow. The images were captured using a confocal microscope equipped with x 60 objective lens. Pearson's correlation coefficient = 0.90; Scale bar, 5 μm. The images are shown in pseudo colors.
Figure 2
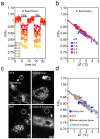
Figure 2. Evaluation of the temperature sensitivity in live HeLa cells.
(a) Schematic representation of the evaluation system based on a confocal laser scanning microscope with an infrared laser. An inset graph shows that the concentric temperature gradient at a microscopic scale. This schematic was originally drawn by one of the authors, S. Arai. (b) (left panels) the regions of interest (ROI) ROI1 and ROI2 were the same distance from a heating spot generated by an infrared laser (15 mW). The temperature rises 3.2°C at ROI1 and ROI2 from a base temperature of 37°C. (right graph) (c–d) The fluorescence images obtained during heating were divided by the image before heating (F/Fo). (c) The temperature mapping of ER thermo yellow was obtained by different laser powers, such as 6 and 15 mW. (d) ER tracker was less sensitive even at a higher laser power of 15 mW. (e) The temperature sensitivity of ER thermo yellow (n = 63) and ER tracker (n = 78) was estimated. ΔT was determined from the distance between the heating spot and the ROI as shown in Fig. 2a. The difference (ΔF/Fo) was plotted against ΔT. n is the number of regions of interests. The numbers of cells range from 8–10. Scale bar, 10 μm.
Figure 3
Figure 3. Validation of the temperature sensitivity of ER thermo yellow.
(a) In fixed HeLa cells, the fluorescence of ER thermo yellow also showed the square wave pattern in response to a temperature difference. (b) The temperature sensitivities in 20 mM HEPES buffer solutions (pH = 5.0, 6.0, 7.0 and 8.0) were 4.0%/°C (R2 = 0.96, n = 41), 3.7%/°C (R2 = 0.97, n = 41), 3.7%/°C (R2 = 0.99, n = 38), 3.8%/°C (R2 = 0.98, n = 44), in order. (c) The pink circle is the tip of the needle at a heating spot. Scale bar, 10 μm. (d) The temperature sensitivity in Chang liver, NIH3T3, Brown adipose tissue (BAT), and C2C12 myotube were 3.8%/°C (R2 = 0.85, n = 56), 3.8%/°C (R2 = 0.94, n = 58), 3.8%/°C (R2 = 0.81, n = 50), 3.7%/°C (R2 = 0.96, n = 47), respectively. In Fig. 3b,d, ΔT was determined from the distance between the heating spot and the ROI. The ΔF/Fo was plotted against ΔT.
Figure 4
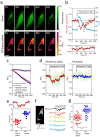
Figure 4. Observation of Ca2+ activated heat production at a single cell level.
(a) Ionomycin was added to the imaging medium at a final concentration of 1.0 μM. Elapsed time is shown to the top left of each image (Scale bar, 5 μm). (b) Time courses of the fluorescence emitted by ER thermo yellow (red line) and Fluo 4 (blue line) are shown. For the control experiment, the time course of ER thermo yellow was monitored after the addition of DMSO (the medium containing 0.05%(v/v)), which is shown in the lower panel. (c) The photobleaching time course of ER thermo yellow (solid red line) and ER tracker (solid blue line). Photobleaching was corrected by fitting with a single exponential curve (dash lines). See Supplementary Figure S10 and S12. (d) The average of the normalized fluorescence intensity was calculated from a total cell area with respect to each cell. The time course of the normalized intensity was plotted against time; ER thermo yellow (left panel, N = 13) and ER tracker as a temperature insensitive dye (right panel, N = 14). The thick line represents the average of the cells. (e) To support the visual comparison in (d), the difference (ΔF/Fo) was calculated from each cell based on the data corresponding to the data as shown in (d). Regarding ER thermo yellow, the ΔF/Fo value was −6.8 ± 1.5% corresponding to 1.7 ± 0.4°C (means ± SD), while ER tracker was 0.6 ± 1.7%. *P<0.001, Student's t-test. (f) Profiles of heat production at the different ROIs within the same cell. (g) According to the method shown in (e), the ΔF/Fo value varying from spot to spot was analyzed in both ER thermo yellow and ER tracker. The average of ER thermo yellow was −6.1 ± 3.1% (N = 6, n = 44) corresponding 1.6 ± 0.8°C (means ± SD), while that of ER tracker was −0.4 ± 3.8% (N = 5, n = 41). *P<0.001, Student's t-test. Scale bar, 5 μm. n is the number of ROIs. N is the number of cells. Photobleaching for all data was corrected by fitting with a single exponential curve as shown in (c).

References

    1. Lowell B. B. & Spiegelman B. M. Towards a molecular understanding of adaptive thermogenesis. Nature 404, 652–60 (2000). - PubMed
    1. Oelkrug R. et al. Brown fat in a protoendothermic mammal fuels eutherian evolution. Nat. Commun. 4, 1–8 (2013). - PMC - PubMed
    1. Fedorenko A., Lishko P. V. & Kirichok, Y. Mechanism of fatty-acid-dependent UCP1 uncoupling in brown fat mitochondria. Cell 151, 400–13 (2012). - PMC - PubMed
    1. Bal N. C. et al. Sarcolipin is a newly identified regulator of muscle-based thermogenesis in mammals. Nat. Med. 18, 1575–9 (2012). - PMC - PubMed
    1. Brites C. D. S. et al. Thermometry at the nanoscale. Nanoscale 4, 4799–829 (2012). - PubMed

Publication types

Substances