. 2014 Oct 21:5:5220.
doi: 10.1038/ncomms6220.

RNaseH1 regulates TERRA-telomeric DNA hybrids and telomere maintenance in ALT tumour cells

Affiliations

RNaseH1 regulates TERRA-telomeric DNA hybrids and telomere maintenance in ALT tumour cells

Rajika Arora et al. Nat Commun. .

Abstract

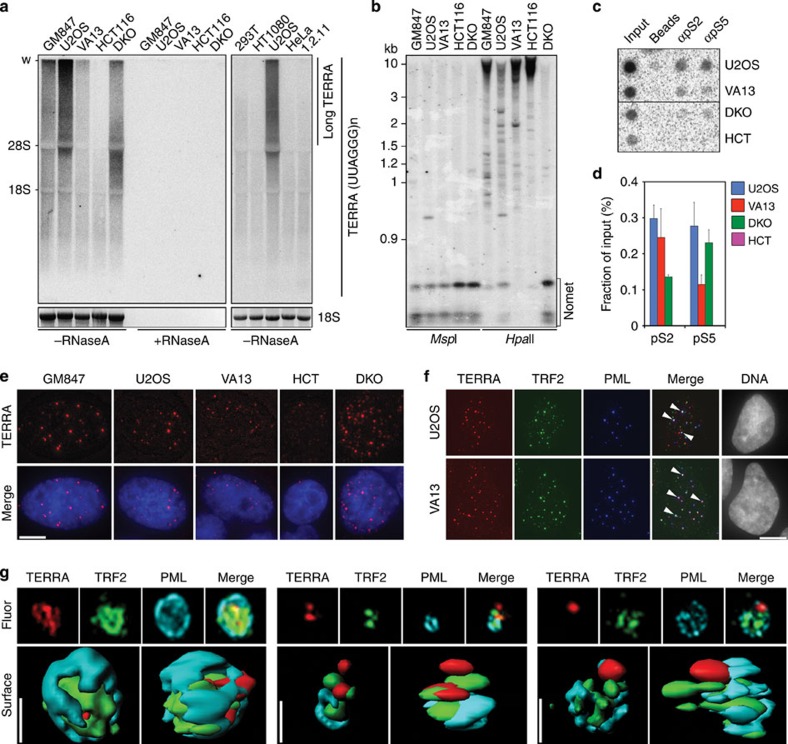
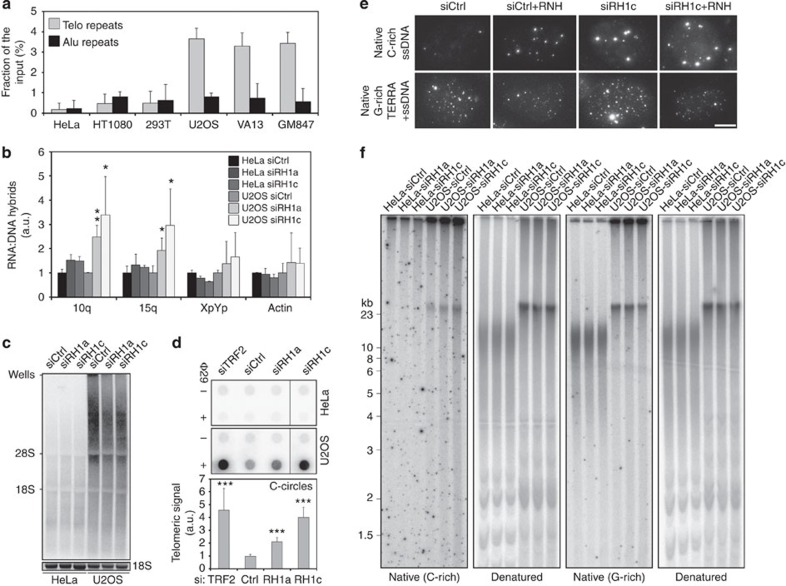
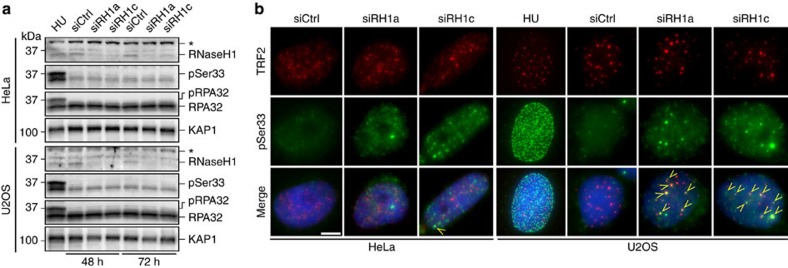
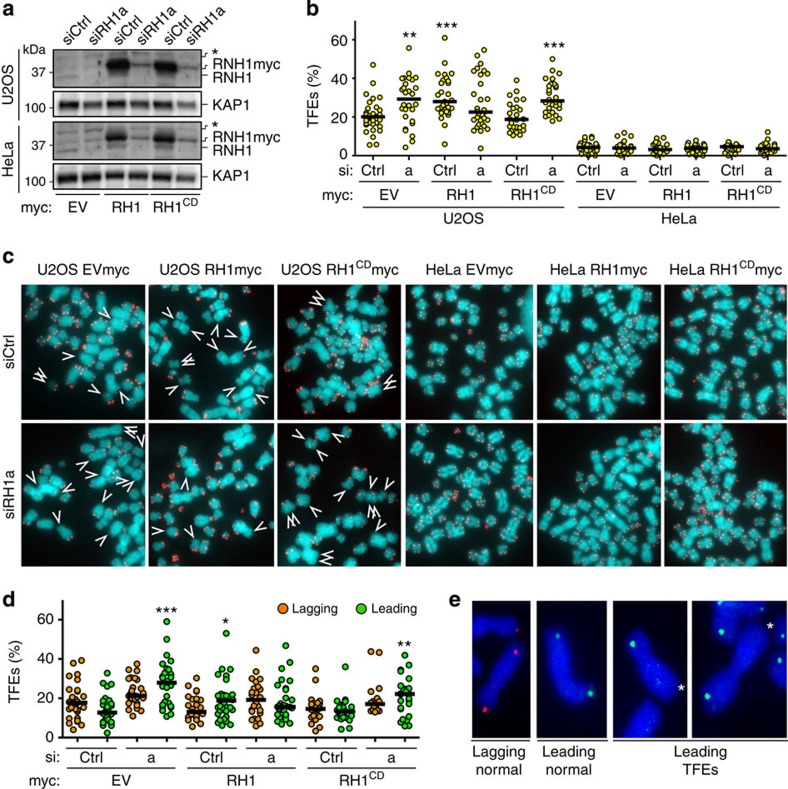
A fraction of cancer cells maintain telomeres through the telomerase-independent, 'Alternative Lengthening of Telomeres' (ALT) pathway. ALT relies on homologous recombination (HR) between telomeric sequences; yet, what makes ALT telomeres recombinogenic remains unclear. Here we show that the RNA endonuclease RNaseH1 regulates the levels of RNA-DNA hybrids between telomeric DNA and the long noncoding RNA TERRA, and is a key mediator of telomere maintenance in ALT cells. RNaseH1 associated to telomeres specifically in ALT cells and its depletion led to telomeric hybrid accumulation, exposure of single-stranded telomeric DNA, activation of replication protein A at telomeres and abrupt telomere excision. Conversely, overexpression of RNaseH1 weakened the recombinogenic nature of ALT telomeres and led to telomere shortening. Altering cellular RNaseH1 levels did not perturb telomere homoeostasis in telomerase-positive cells. RNaseH1 maintains regulated levels of telomeric RNA-DNA hybrids at ALT telomeres to trigger HR without compromising telomere integrity too severely.


Figures

Figure 1
Figure 1. TERRA and telomere transcription in ALT cells.
(a) TERRA northern blot hybridizations of RNA from the indicated cell lines (VA13: WI-38 VA13; 1.2.11: HeLa 1.2.11) pre-treated with RNaseA or left untreated. Ethidium bromide stained 18S ribosomal RNA (rRNA) is shown to control for loading. Long TERRA molecules comprised between the wells of the gels (w) and 28S rRNA are indicated. (b) TERRA CpG-island promoter methylation analysis of the indicated cell lines. Genomic DNA was digested with the methylation sensitive restriction enzyme MspI or its methylation insensitive isoschizomer HpaII. DNA was hybridized using a radioactively labelled probe detecting TERRA promoter CpG-island repeats. Nomet: fragments corresponding to unmethylated restriction products. (c) Dot blot hybridization of DNA immunoprecipitated with antibodies against phosphorylated Serines S2 and S5 of RNA polymerase II C-terminal domain. Hybridizations were performed with a telomeric probe. Quantifications are shown at the bottom. (d) Bars and error bars are averages and s.d. from three independent experiments. (e) Examples of TERRA FISH in the indicated cells. TERRA is shown in red, DAPI-stained DNA in blue. Scale bar, 9 μm. (f) IF/FISH experiments in the indicated cell lines. TERRA is in red, TRF2 in green and PML in blue. In the merge panels, arrowheads point to nuclear foci where the three factors co-localize. Scale bar, 9 μm. (g) Information surface at 0.01 μm detail level of three TERRA-containing APBs. TERRA is in red, TRF2 in green and PML in cyan. Images were generated with Three-Dimensional Structured Illumination Microscopy (3D-SIM). Scale bars, 0.4 μm.
Figure 2
Figure 2. Transcription induction promotes telomeric aberrations and RNA–DNA hybrids in ALT cells.
TiTEL transcription was induced for 48 h before performing FISH and CO-FISH experiments. (a) Examples of normal and aberrant tiTELs (arrows) detected by FISH. TiTEL chromosome ends were visualized with lacO PNA probes (green), telomeric repeats with telomeric C-rich probes (red), DNA was counterstained with DAPI (blue). (b) Quantification of aberrations at tiTELs and telomeres at opposite chromosome ends (opp). Untreated samples were set to 1. Bars and error bars are averages and s.d. from at least three experiments where a total of at least 180 tiTEls and opposite chromosome ends were scored. P-values were computed using the Student’s t-test. *P<0.05 (+dox versus −dox). (c) Quantification of telomeric hybrids at tiTELs in U2OS and HeLa cells measured by DIP using the S9.6 antibody. U2OS untreated samples were set to 1. Bars and error bars are averages and s.d. from at least three experiments. P-values were computed using the Student’s t-test. *P<0.05 (+dox versus −dox).
Figure 3
Figure 3. RNaseH1 functions at ALT telomeres.
(a) Quantification of ChIP dot blot experiments performed in the indicated cell lines using antibodies against endogenous RNaseH1. DNA was first hybridized with telomeric probes and then with Alu repeat probes for specificity. Immunoprecipitated DNA is expressed as fraction of input DNA after subtraction of the background signal associated to control ChIPs using normal IgGs. Bars and error bars are averages and s.d. from three to five experiments. (b) Quantification of telomeric hybrids from the indicated chromosome ends and actin locus measured in S9.6 DIP experiments using cells transfected for 72 h with control siRNAs (siCtrl, set to 1) or siRNAs against RNaseH1 (siRH1a and c). Hybrids are expressed as fractions of the input material after subtraction of values from control immunoprecipitations with only beads. Bars and error bars are averages and s.d. from at least three experiments. P-values were computed using the Student’s t-test. *P<0.05, **P<0.005 (siRH1a or c versus siCtrl). (c) TERRA northern blot using total RNA from RNaseH1-depleted cells. (d) C-circle assays in siRNA transfected HeLa and U2OS cells. Anti-TRF2 siRNA was used as a positive control. Dot blots were hybridized with a C-rich telomeric probe in native conditions. Negative controls are reactions performed in the absence of the Ф29 enzyme. Quantification of C-circle signals for U2OS cells is at the bottom where siCtrl was set to 1. Bars and error bars are averages and s.d. from at least three experiments. P-values were computed using the Student’s t-test. ***P<0.0001 (siRH1a, siRH1c or siTRF2 versus siCtrl). (e) Native FISH experiments in U2OS cells transfected with the indicated siRNAs and treated or not with RNaseH (RNH) in vitro prior to hybridization. In the upper panels, C-rich ssDNA is detected with a G-rich telomeric probe; in the lower panels TERRA and telomeric G-rich ssDNA are detected simultaneously with a C-rich telomeric probe. Scale bar, 9 μm. (f) In-gel telomere restriction fragment analysis using digested genomic DNA prepared from cells depleted for RNaseH1. Hybridizations were first performed in native conditions using either a telomeric G-rich oligonucleotide probe (to detect single-stranded telomeric C-rich DNA; first panel from the left) or a telomeric C-rich oligonucleotide probe (to detect single-stranded telomeric G-rich DNA; third panel from the left). The same gels were denatured and re-hybridized with a double-stranded telomeric probe.
Figure 4
Figure 4. RNaseH1 depletion leads to RPA activation at ALT telomeres.
(a) HeLa and U2OS cells were transfected with the indicated siRNAs and 48 and 72 h later protein extracts were prepared. Western blot analysis was performed using antibodies against RNaseH1, RPA32 phosphorylated at Serine 33 (pSer33), total RPA32 and KAP1 (loading control). The asterisk indicates a cross-reacting band. Cells treated for 6 h with 5 mM hydroxyurea (HU) were used as controls for pSer33 activation. (b) SiRNA transfected cells were subjected to indirect immunofluorescence using antibodies against TRF2 (to visualize telomeres; red) and pSer33 (green). DNA was counterstained with DAPI (blue). Arrows point to examples of pSer33 foci co-localizing with TRF2 (TIFs). Scale bar, 9 μm. Cells treated for 6 h with 5 mM HU were used as controls for pSer33 activation.
Figure 5
Figure 5. RNaseH1 depletion affects leading-strand telomeres in U2OS cells.
(a) Western blot analysis of total proteins from U2OS and HeLa cells infected with retroviruses expressing myc-tagged RNaseH1 (RH1) or catalytically dead RNaseH1 (RH1CD) or with empty vector control retroviruses (EV) and transfected with the indicated siRNAs. Experiments were performed 6 days after infections and 3 days after siRNA transfections. Endogenous and myc-tagged RNaseH1 proteins were simultaneously detected using anti-RNaseH1 antibodies. The asterisk indicates a cross-reacting band. Total KAP1 was detected to control for loading. (b) Quantifications of TFEs in the indicated cells. Each dot represents the fraction of TFEs per chromosome end in one metaphase from two to three independent experiments. Chromosome ends (2,700–3,640) were analyzed for each condition. Black bars indicate medians. P-values were computed using the Student’s t-test. ***P<0.0001 (indicated sample versus siCtrl-transfected EVmyc sample). (c) Examples of FISH experiments performed on metaphase spreads from the indicated cells. Telomeric DNA is in red and DAPI-stained total DNA in blue. Arrows point to TFEs. (d) Quantifications of leading and lagging TFEs from CO-FISH experiments performed on the indicated U2OS cells. Each dot represents the fraction of TFEs per chromosome end in one metaphase from two to three independent experiments. Chromosome ends (1,900–3,900) were analyzed for each condition. Black bars indicate medians. P-values were computed using the Student’s t-test. *P<0.05, **P<0.001, ***P<0.0001 (indicated sample versus siCtrl-transfected EVmyc sample). (e) Examples of CO-FISH experiments performed on U2OS cells. Lagging-strand telomeres are in red, leading-strand telomeres are in green and DNA is in blue. Example of normal telomeres and TFEs are shown.
Figure 6
Figure 6. Overexpression of RNaseH1 compromises telomere maintenance in ALT cells.
(a) Quantifications of fragile telomeres (FTs) and telomere free ends (TFEs) in metaphase spreads from U2OS and HeLa cells infected for 6 days with the indicated retroviruses. Each dot represents the fraction of indicated telomeric aberrations per chromosome end in one metaphase from two to three independent experiments. Chromosome ends (1,200–6,000) were analyzed for each condition. Black bars indicate medians. P-values were computed using the Student’s t-test. *P<0.05, **P<0.001 (indicated sample versus EVmyc sample). (b) Quantifications of leading and lagging TFEs and FTs and of DTSs from CO-FISH experiments performed on U2OS cells infected for 6 days with the indicated retroviruses. Each dot represents the fraction of indicated telomere feature per chromosome end in one metaphase from two to three independent experiments. Chromosome ends (1,900–7,800) were analyzed for each condition. Black bars indicate medians. P-values were computed using the Student’s t-test. *P<0.05, **P<0.001, ***P<0.0001 (indicated sample versus EVmyc sample). (c) Enlarged examples of DNA FISH and CO-FISH experiments on U2OS cells. (d) Partial metaphase spreads from the indicated cells infected with retroviruses for 13 days. (e) Quantifications of FTs and TFEs on metaphase spreads obtained from cells infected for 13 days with the indicated retroviruses. Chromosome ends (1,200–2,400) were analyzed for each condition. Black bars indicate medians. ***P<0.0001 (RH1myv versus EVmyc). (f) Western blot analysis of proteins from cells as in e performed with antibodies against RNaseH1 and total KAP1 (loading control). The asterisk indicates a cross-reacting band. (g) Consequences of altering RNaseH1 (RH1) cellular levels and telomeric hybrids on ALT telomere maintenance. Question mark indicates displaced G-rich telomeric DNA loops, whose existence remains to be verified.

Similar articles

Cited by

References

    1. Palm W. & de Lange T. How shelterin protects mammalian telomeres. Annu. Rev. Genet. 42, 301–334 (2008). - PubMed
    1. O'Sullivan R. J. & Karlseder J. Telomeres: protecting chromosomes against genome instability. Nat. Rev. Mol. Cell Biol. 11, 171–181 (2010). - PMC - PubMed
    1. Hug N. & Lingner J. Telomere length homoeostasis. Chromosoma 115, 413–425 (2006). - PubMed
    1. Arora R., Brun C. M. & Azzalin C. M. TERRA: long noncoding RNA at eukaryotic telomeres. Prog. Mol. Subcell. Biol. 51, 65–94 (2011). - PubMed
    1. Feuerhahn S., Iglesias N., Panza A., Porro A. & Lingner J. TERRA biogenesis, turnover and implications for function. FEBS Lett. 584, 3812–3818 (2010). - PubMed

Publication types

MeSH terms