. 2014 Dec 11;124(25):3719-29.
doi: 10.1182/blood-2014-06-582700. Epub 2014 Oct 20.

Global transcriptome analysis and enhancer landscape of human primary T follicular helper and T effector lymphocytes

Affiliations

Global transcriptome analysis and enhancer landscape of human primary T follicular helper and T effector lymphocytes

Jason S Weinstein et al. Blood. .

Abstract

T follicular helper (Tfh) cells are a subset of CD4(+) T helper cells that migrate into germinal centers and promote B-cell maturation into memory B and plasma cells. Tfh cells are necessary for promotion of protective humoral immunity following pathogen challenge, but when aberrantly regulated, drive pathogenic antibody formation in autoimmunity and undergo neoplastic transformation in angioimmunoblastic T-cell lymphoma and other primary cutaneous T-cell lymphomas. Limited information is available on the expression and regulation of genes in human Tfh cells. Using a fluorescence-activated cell sorting-based strategy, we obtained primary Tfh and non-Tfh T effector cells from tonsils and prepared genome-wide maps of active, intermediate, and poised enhancers determined by chromatin immunoprecipitation-sequencing, with parallel transcriptome analyses determined by RNA sequencing. Tfh cell enhancers were enriched near genes highly expressed in lymphoid cells or involved in lymphoid cell function, with many mapping to sites previously associated with autoimmune disease in genome-wide association studies. A group of active enhancers unique to Tfh cells associated with differentially expressed genes was identified. Fragments from these regions directed expression in reporter gene assays. These data provide a significant resource for studies of T lymphocyte development and differentiation and normal and perturbed Tfh cell function.


Figures

Figure 1
Figure 1
FACS. (A) Primary human Tfh, Teff, and naive T-cell populations were isolated from tonsil via FACS as shown. (B) Intracellular staining for Foxp3 was used to identify the percentage of Tfr cells within the Tfh cell population. Representative flow cytometry plots (left) show the percentages of Foxp3+ Tfh or Teff cells in the tonsils using the gating strategy as described in panel A, with data quantified from 5 different patients (right).
Figure 2
Figure 2
Transcriptome analyses: human primary Tfh, Teff, and naive T cells have distinct expression profiles. (A) Tfh, Teff, and naive T-cell transcriptomes were obtained by RNA-seq and subjected to multidimensional scaling analysis of expressed genes. Symbols representing 3 or 4 biologic replicates of Tfh (red squares), Teff (blue circles), and naive T cells (green triangles) clustered together, indicating that samples from each cell type are closely related and distinct from the other cell types. (B) Venn diagram display of differentially expressed genes. (C) Heat map display of gene expression patterns of differentially expressed genes. Red represents elevated expression while blue represents decreased expression, compared with the row mean. Each column represents a biologic replicate. Genes displayed in panels B and C were selected based on fold changes of 2 or more and FDR adjusted P value < .05 between cell types. (D) RNA coverage profiles of representative differentially expressed genes. FDR, false discovery rate.
Figure 3
Figure 3
Histone-modification density and enhancer class in human primary Tfh cell chromatin. The signal density of H3K4me1, H3K27Ac, H3K27me3, and background TI chromatin is plotted relative to the H3K4me1 peak. (A-C) The average signal over all enhancers in the active, intermediate, and poised enhancer classes, respectively. (D) Signal for each enhancer in the active (A), intermediate (I), and poised (P) enhancer classes. TI, total input.
Figure 4
Figure 4
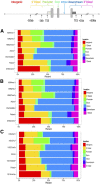
Distribution of histone modifications, and active, intermediate, and poised enhancers in human primary Tfh and Teff cell chromatin. The human genome was portioned into 7 bins relative to RefSeq genes. The percentage of the human genome represented by each bin was color coded, and the distribution of peaks of each histone modification and enhancer class, active, intermediate, and poised, in each bin graphed on the color-coded bar. (A) Tfh cells. (B) Teff cells. (C) K562 cells are included as a nonlymphocyte, hematopoietic cell type for comparison. TES, transcriptional end site.
Figure 5
Figure 5
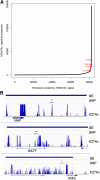
Superenhancers in Tfh cells. (A) Distribution of H3K27Ac normalized ChIP-seq signal across Tfh cell enhancers. Superenhancers are shown in red. Select superenhancer-associated genes are labeled. (B) Representative Tfh cell superenhancers associated with immune-related SNPs at 3 gene loci: MAF, BATF, and IRF4. The called superenhancer is denoted by the thick blue line at the top of the figure. The associated SNP is shown below the superenhancer line. The track of H3K27 acetylated chromatin is shown above the associated gene locus.
Figure 6
Figure 6
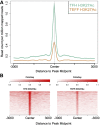
Differential histone 3 lysine 27 acetylation in Tfh and Teff cells. Differentially H3K27 acetylated enhancers in Tfh and Teff cell chromatin were identified. (A) The signal density of H3K27Ac was plotted relative to the H3K4me1 peak. (A) The average signal over all differentially acetylated enhancers in Tfh and Teff cells is shown. (B) The signal for each differentially acetylated enhancer in both cell types.
Figure 7
Figure 7
Tfh cell type–specific active enhancers. (A) A differentially acetylated enhancer 5′ of the PDCD1 gene locus in Tfh cells is shown (red bar). Normalized RNA sequencing read density from each cell type at the PDCD1 gene locus is shown below. (B) A differentially acetylated enhancer in intron 1 of the BCL6 gene locus in Tfh cells is shown (red bar). Normalized RNA sequencing read density from each cell type at the BCL6 gene locus is shown below.

References

    1. Choi YS, Yang JA, Crotty S. Dynamic regulation of Bcl6 in follicular helper CD4 T (Tfh) cells. Curr Opin Immunol. 2013;25(3):366–372. - PMC - PubMed
    1. Crotty S. Follicular helper CD4 T cells (TFH). Annu Rev Immunol. 2011;29:621–663. - PubMed
    1. Weinmann AS. Regulatory mechanisms that control T-follicular helper and T-helper 1 cell flexibility. Immunol Cell Biol. 2014;92(1):34–39. - PubMed
    1. Crotty S. The 1-1-1 fallacy. Immunol Rev. 2012;247(1):133–142. - PubMed
    1. Johnston RJ, Poholek AC, DiToro D, et al. Bcl6 and Blimp-1 are reciprocal and antagonistic regulators of T follicular helper cell differentiation. Science. 2009;325(5943):1006–1010. - PMC - PubMed

Publication types

MeSH terms

Associated data