. 2014 Oct 20;15(1):911.
doi: 10.1186/1471-2164-15-911.

Extensive stage-regulation of translation revealed by ribosome profiling of Trypanosoma brucei

Affiliations

Extensive stage-regulation of translation revealed by ribosome profiling of Trypanosoma brucei

Bryan C Jensen et al. BMC Genomics. .

Abstract

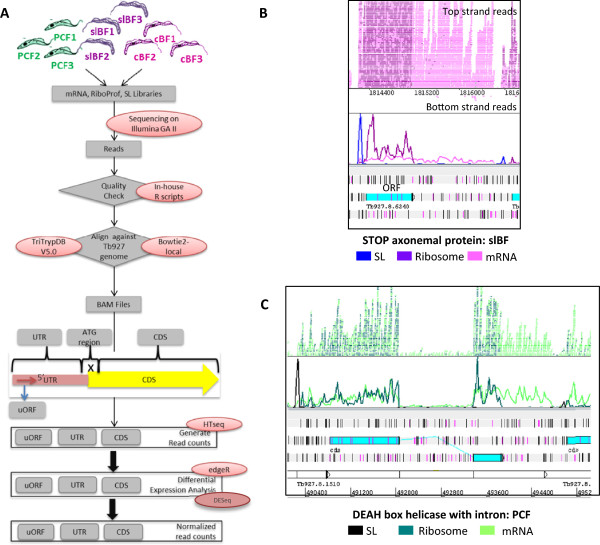
Background: Trypanosoma brucei subspecies infect humans and animals in sub-Saharan Africa. This early diverging eukaryote shows many novel features in basic biological processes, including the use of polycistronic transcription to generate all protein-coding mRNAs. Therefore we hypothesized that translational control provides a means to tune gene expression during parasite development in mammalian and fly hosts.

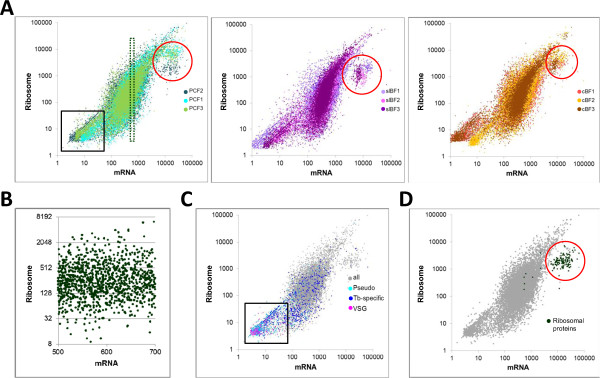
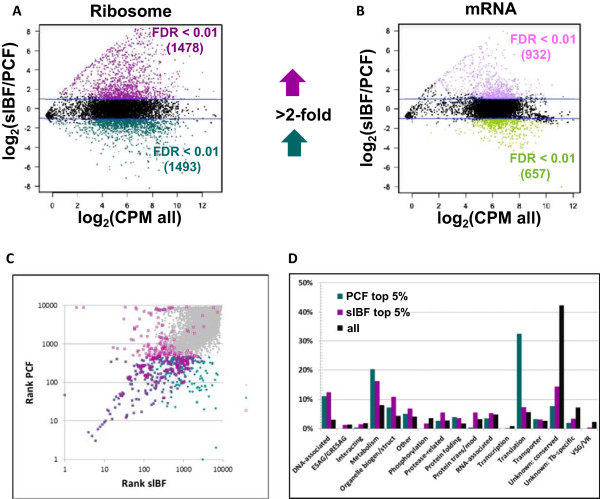
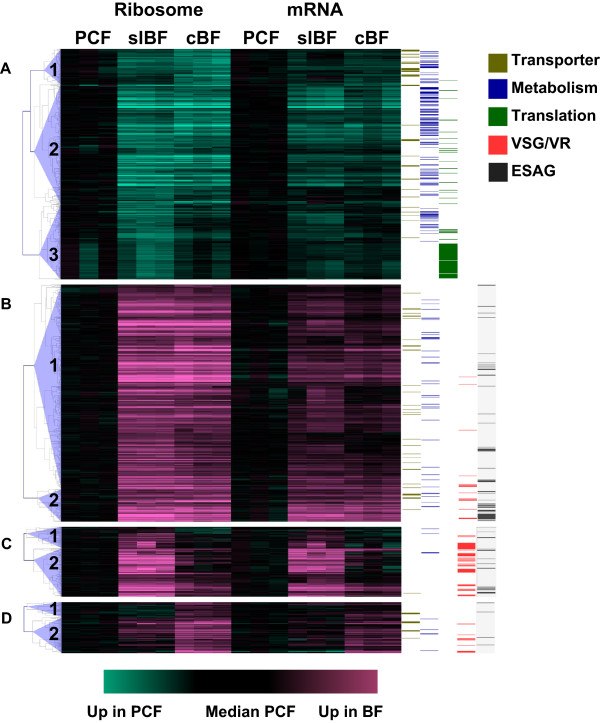
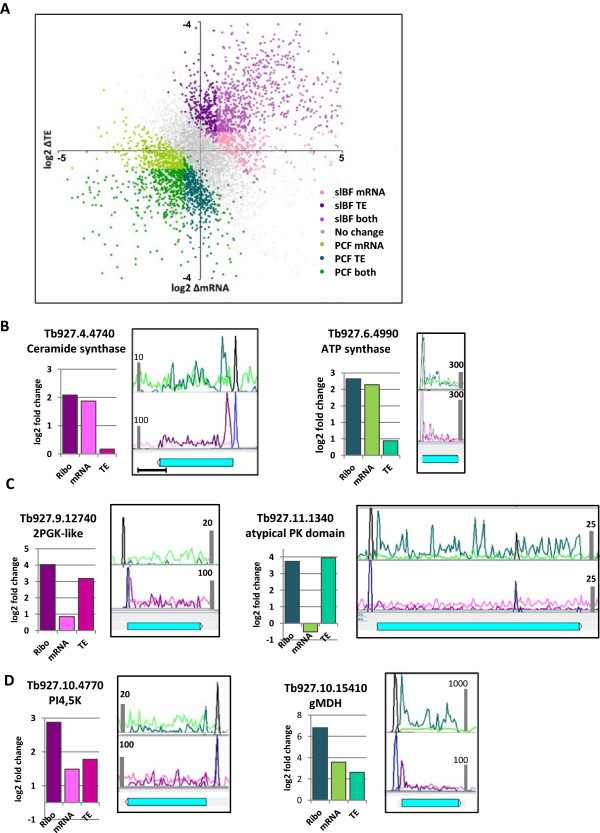
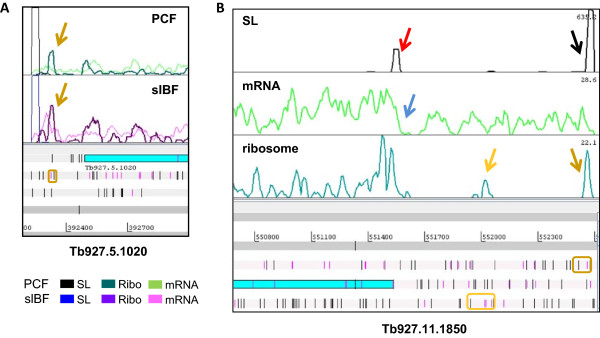
Results: We used ribosome profiling to examine genome-wide protein synthesis in animal-derived slender bloodstream forms and cultured procyclic (insect midgut) forms. About one-third of all CDSs showed statistically significant regulation of protein production between the two stages. Of these, more than two-thirds showed a change in translation efficiency, but few appeared to be controlled by this alone. Ribosomal proteins were translated poorly, especially in animal-derived parasites. A disproportionate number of metabolic enzymes were up-regulated at the mRNA level in procyclic forms, as were variant surface glycoproteins in bloodstream forms. Comparison with cultured bloodstream forms from another strain revealed stage-specific changes in gene expression that transcend strain and growth conditions. Genes with upstream ORFs had lower mean translation efficiency, but no evidence was found for involvement of uORFs in stage-regulation.

Conclusions: Ribosome profiling revealed that differences in the production of specific proteins in T. brucei bloodstream and procyclic forms are more extensive than predicted by analysis of mRNA abundance. While in vivo and in vitro derived bloodstream forms from different strains are more similar to one another than to procyclic forms, they showed many differences at both the mRNA and protein production level.


Figures

Figure 1
Figure 1
The ribosome profiling system. A) Diagram of work flow. B) Visualization of the sequence mapping onto the genome in Artemis. This image shows the spliced leader, ribosome footprint and mRNA reads mapping to the region of the STOP axonemal protein gene in slBF. Reads are color-coded as shown below the image; data for expression in slBF are shown in purple-pink throughout the manuscript. Here and elsewhere, start codons are shown in pink in the three reading frames while stop codons are black. The numbers under the stacked reads correspond to the coordinates in the chromosome and the GeneID for TriTrypDB is shown. C) SL, ribosome profiling, and mRNA reads mapping to the region of a DEAH box helicase gene in PCF. This gene is one of only two genes in the T. brucei genome that has an intron. Note the lack of ribosome profiling reads in the intron even though a low level of mRNA is present. Data for expression in PCF are shown in blue-green colors throughout.
Figure 2
Figure 2
Overview of the translational landscape. A) Ribosome footprint and mRNA edgeR-normalized RPK for all genes, including pseudogenes, are shown. Each panel includes all biological replicates for a given stage, which are shown in different shades. The box outlines the genes with <50 RPK, the dotted box is enlarged in panel B; and the circle marks a set of genes with high mRNA read counts but relatively lower ribosome read counts that is referred to in the text. B) Illustration of large differences in ribosome association with mRNAs expressed to similar levels in PCF sample 2. Note that the x-axis is linear and the y-axis is log2. C) Expression levels of pseudogenes, VSG genes and T. brucei specific genes in PCF. The boxed area (<50 RPK) is comprised mostly of pseudogenes (cyan dots) and VSG genes (pink dots) and a subset of the T. brucei specific genes (blue dots). D) The cluster of genes with reduced translation efficiency corresponds to structural components of the cytosolic ribosome (green dots).
Figure 3
Figure 3
Ribosome profiling reveals extensive differential protein production. In this smear plot the fold change in read counts for ribosome footprint (A) and mRNA (B) were plotted against average read counts per million reads of the pooled libraries for slBF and PCF. Dots that lie outside the blue lines are up-regulated at least 2-fold. Those that are statistically supported (FDR ≤0.01) are colored (green/dark green for PCF and pink/magenta for slBF). Note that almost twice as many genes (2971) up-regulated for protein production as compared to mRNA expression (1589). C) Stage-regulation of genes most highly expressed at the level of protein production. This dot plot depicts the gene rank for protein production in slBF and PF. The rank is based on median ribosome footprint RPK in the biological replicates. Those in the top 5% for slBF are outlined in magenta, those in the top 5% for PCF are green, and those that are in the top 5% for both appear purple. The remaining genes are marked in gray. D) Categorization of most highly expressed genes compared to genome-wide representation. Top 5% of slBF, magenta; top 5% PCF, green; genome, black.
Figure 4
Figure 4
Cluster analysis reveals distinct patterns of gene expression. All 1557 genes showing > four-fold change in ribosome footprint edgeR-normalized read counts (with FDR < 0.01 and excluding pseudogenes) between PCF and slBF or cBF were analyzed using MeV (see Methods). The ribosome footprint and mRNA read counts in each of the nine samples were converted to log2 fold-change values compared to the corresponding median of the three PCF samples and segregated into four clusters (A-D) by K-means (KMC Support), each of which was then separated into 2 or 3 sub-sets by hierarchical clustering. Genes up-regulated in PCF are shown in aqua, while those up-regulated in slBF or cBF are shown in pink. The position of genes encoding transporters (olive), metabolic enzymes (blue), translation machinery (blue), VSGs/VRs (red) or ESAGs (black) are indicated by the colored bars to the right.
Figure 5
Figure 5
Regulation of gene expression at the level of TE and mRNA abundance. A) Genome-wide plot of the change in TE versus the change in mRNA between slBF and PCF, expressed as log2 ratios. B-D) Examples of genes where changes in protein production are mediated by different mechanisms. Panel B, regulation primarily by changes in mRNA abundance; Panel C, regulation primarily by changes in TE, and Panel D, regulation in which changes in both mRNA and TE contribute strongly. The histograms show the median log2-normalized fold change in read counts for ribosome footprint, mRNA and the TE. In the histograms, magenta tones are used for genes up-regulated in slBF while green tones are used for those up-regulated in PCF. The Artemis view from PCF3 (green) and slBF3 (magenta) are shown for each gene, with ribosome footprint being the dark color and mRNA being the light color. Similar changes were seen for cBF versus PCF. The genes depicted in this figure had negligible multi-mapping reads. The bars at the edge of the graphs indicate the relative scaling of ribosome profiling and mRNA read counts in the two stages. The SL reads (black in PCF, blue in slBF) are not to scale. The scale bar below the first panel represents 500 nt, used for all images).
Figure 6
Figure 6
Predicted uORFs and translation. A) Example of a translated uORF that convincingly lies on the same transcript as the main CDS. A 5 aa uORF outlined in gold and delineated by the start codon (pink line) and a subsequent stop codon (black line) in the reading frame 2 is associated with the main CDS of Tb927.5.1020. It is translated in both stages (RRS = 23.5). We do not see a significant difference in TE of the main CDS between stages (slBF:PCF Δlog2 TE = -0.25). B) Candidate uORFs may not not lie on the same transcript as the CDS of Tb927.11.1850. Predicted uORFs are seen in all three reading frames downstream of the computationally predicted 5′ end of the mRNA defined by a peak in SL reads as described in Methods (black arrow). Two of these uORFs bear ribosome footprints with RRS scores >70 (gold arrows; ORFs are outlined on the map). The blue arrow marks a dip in the mRNA levels, followed by a second trans-splicing site just before the main CDS (red arrow). Thus, it is not convincing that most transcripts bearing the Tb927.11.1850 CDS also bear these putative uORFs. Data are shown for PCF3, although similar profiles were seen with slBF.

References

    1. Kramer S. Developmental regulation of gene expression in the absence of transcriptional control: The case of kinetoplastids. Mol Biochem Parasitol. 2011;181:61–72. doi: 10.1016/j.molbiopara.2011.10.002. - DOI - PubMed
    1. Urbaniak MD, Guther ML, Ferguson MA. Comparative SILAC proteomic analysis of Trypanosoma brucei bloodstream and procyclic lifecycle stages. PLoS One. 2012;7:e36619. doi: 10.1371/journal.pone.0036619. - DOI - PMC - PubMed
    1. Urbaniak MD, Martin D, Ferguson MA. Global quantitative SILAC phosphoproteomics reveals differential phosphorylation is widespread between the procyclic and bloodstream form lifecycle stages of Trypanosoma brucei. J Proteome Res. 2013;12:2233–2244. doi: 10.1021/pr400086y. - DOI - PMC - PubMed
    1. Diehl S, Diehl F, El Sayed NM, Clayton C, Hoheisel JD. Analysis of stage-specific gene expression in the bloodstream and the procyclic form of Trypanosoma brucei using a genomic DNA-microarray. Mol Biochem Parasitol. 2002;123:115–123. doi: 10.1016/S0166-6851(02)00138-X. - DOI - PubMed
    1. Koumandou VL, Natesan SK, Sergeenko T, Field MC. The trypanosome transcriptome is remodelled during differentiation but displays limited responsiveness within life stages. BMC Genomics. 2008;9:298. doi: 10.1186/1471-2164-9-298. - DOI - PMC - PubMed

Publication types

MeSH terms