. 2015 Feb;33(2):208-15.
doi: 10.1002/jor.22752. Epub 2014 Oct 20.

Systemic injection of CK2.3, a novel peptide acting downstream of bone morphogenetic protein receptor BMPRIa, leads to increased trabecular bone mass

Affiliations

Systemic injection of CK2.3, a novel peptide acting downstream of bone morphogenetic protein receptor BMPRIa, leads to increased trabecular bone mass

Hemanth Akkiraju et al. J Orthop Res. 2015 Feb.

Abstract

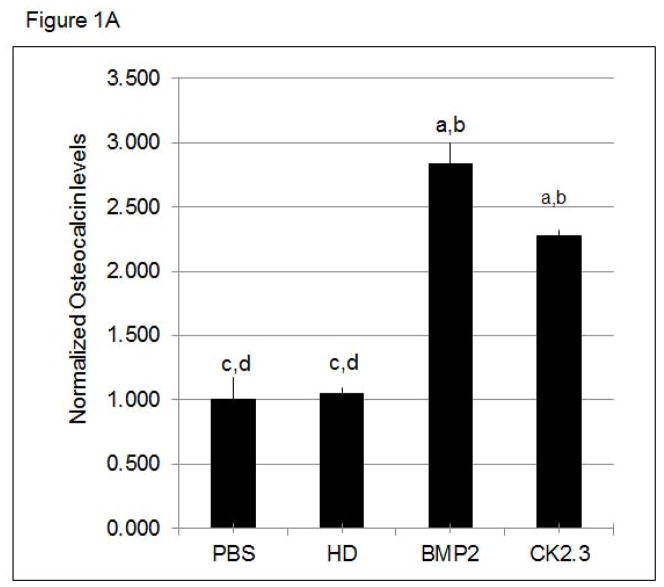
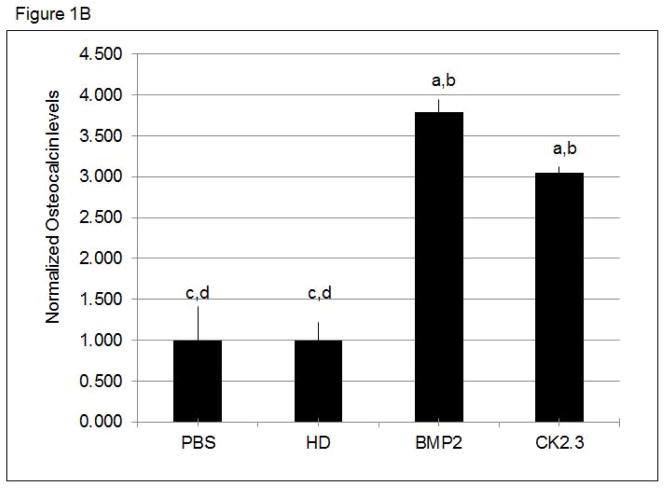
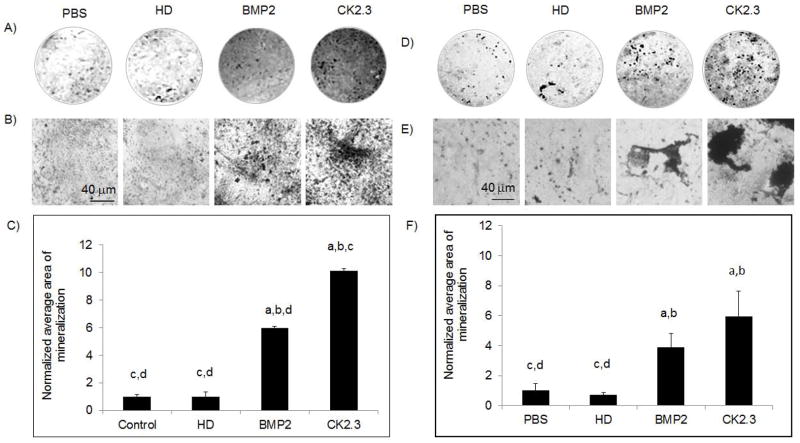
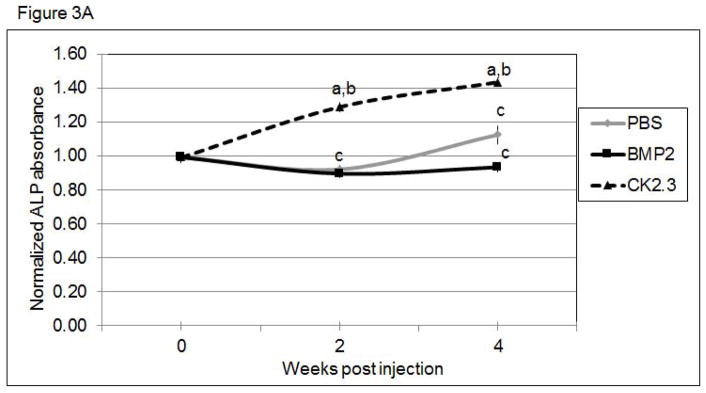
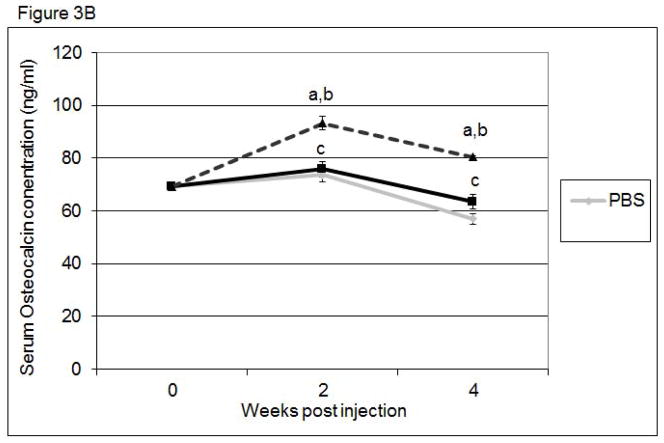
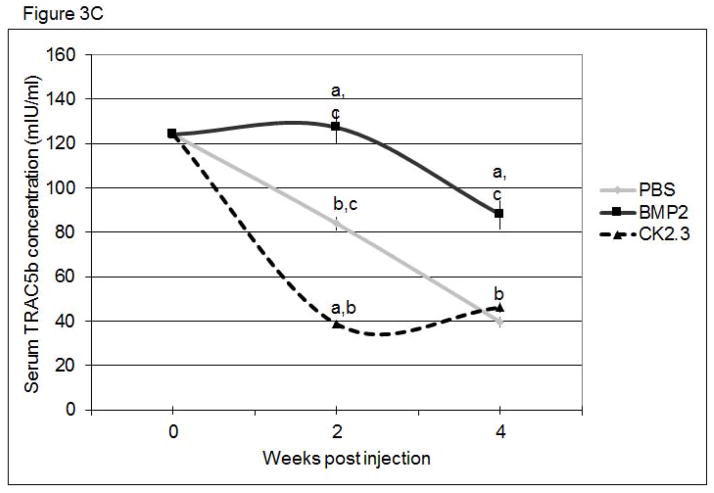
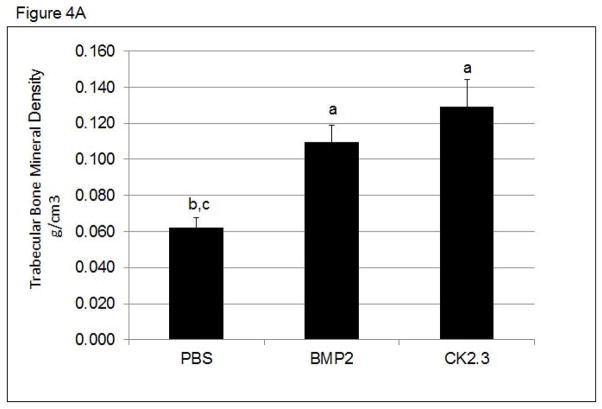
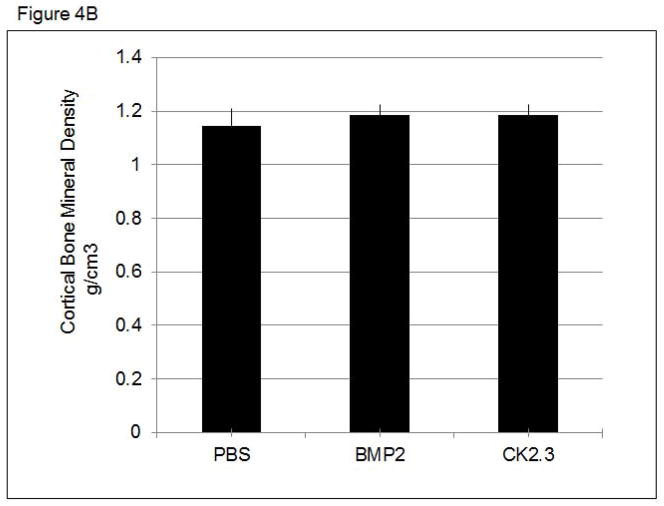
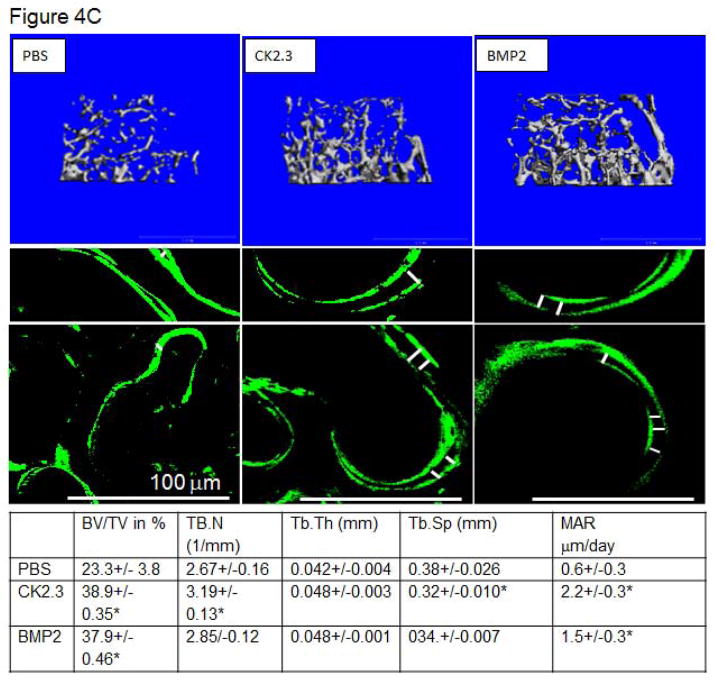
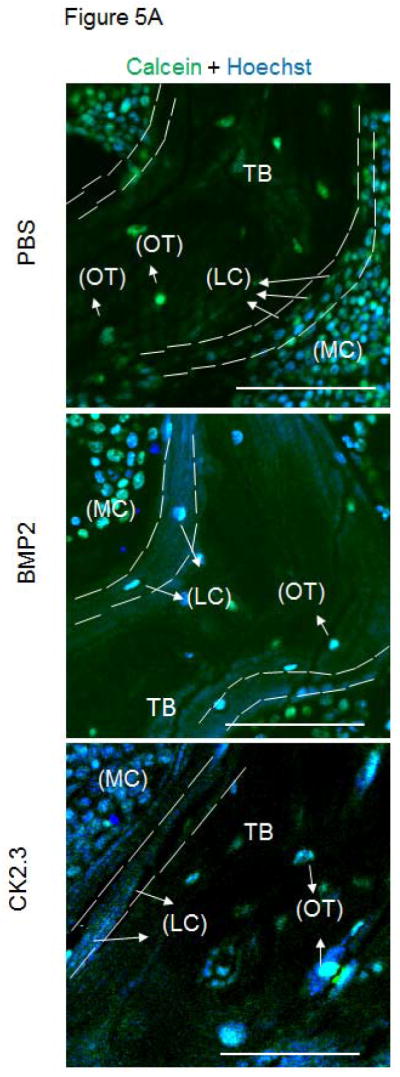
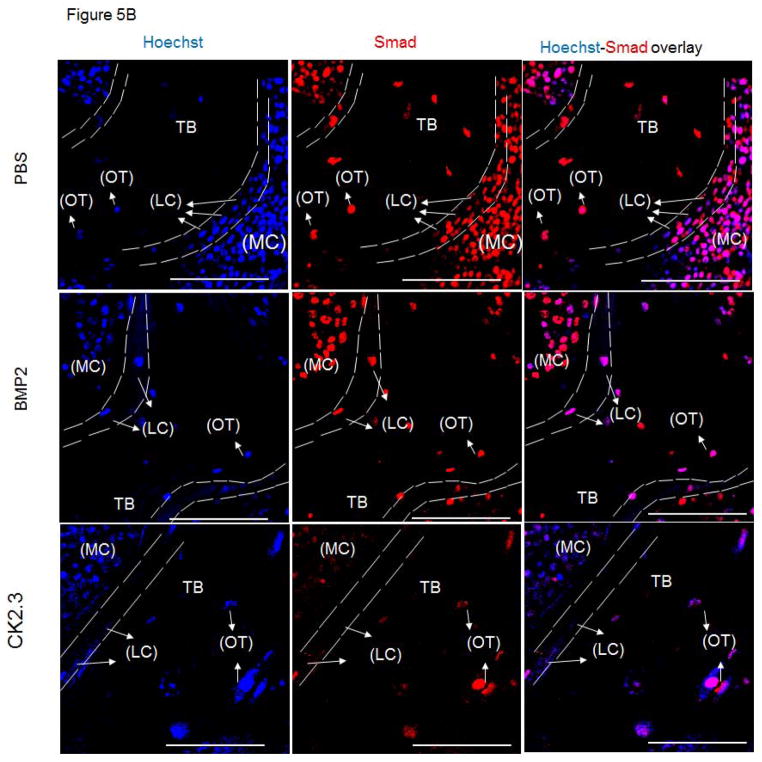
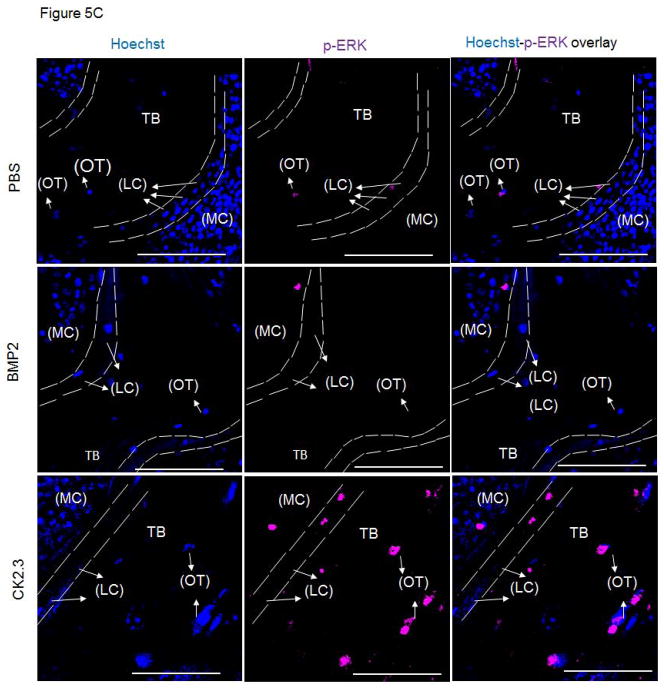
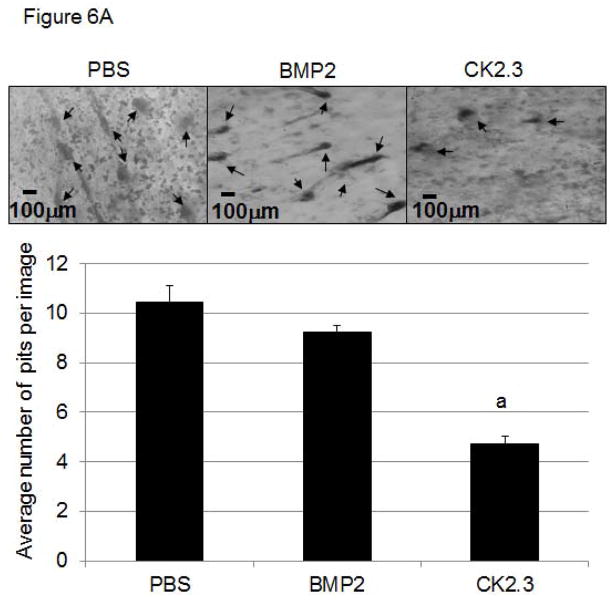
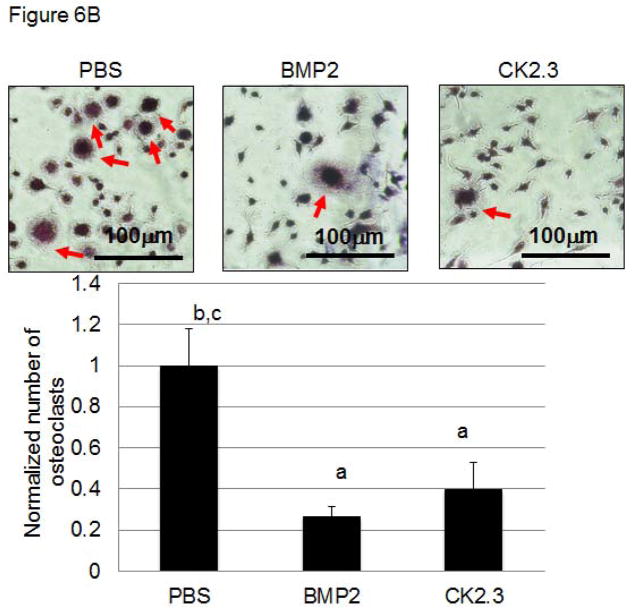
Bone Morphogenetic Protein 2 (BMP2) regulates bone integrity by driving both osteogenesis and osteoclastogenesis. However, BMP2 as a therapeutic has significant drawbacks. We have designed a novel peptide CK2.3 that blocks the interaction of Casein Kinase 2 (CK2) with Bone Morphogenetic Protein Receptor type Ia (BMPRIa), thereby activating BMP signaling pathways in the absence of ligand. Here, we show that CK2.3 induced mineralization in primary osteoblast cultures isolated from calvaria and bone marrow stromal cells (BMSCs) of 8 week old mice. Further, systemic tail vein injections of CK2.3 in 8 week old mice resulted in increased bone mineral density (BMD) and mineral apposition rate (MAR). In situ immunohistochemistry of the femur found that CK2.3 injection induced phosphorylation of extracellular signal-related kinase (ERK), but not Smad in osteocytes and osteoblasts, suggesting that CK2.3 signaling occurred through Smad independent pathway. Finally mice injected with CK2.3 exhibited decreased osteoclast differentiation and osteoclast activity. These data indicate that the novel mimetic peptide CK2.3 activated BMPRIa downstream signaling to enhance bone formation without the increase in osteoclast activity that accompanies BMP 2 stimulation.

Keywords: bone mineral density; bone morphogenetic protein; casein kinase 2; mimetic peptide; osteoporosis.


Figures

Figure 1
Figure 1. CK2.3 stimulation of primary cells led to increased Osteoclacin levels
Osteocalcin levels are increased in the supernatant of A) calvaria cells and B) BMSCs stimulated with PBS, HD (Antennapedia Homeodomain), 40nM BMP2, and 100nM CK2.3. At least 3 independent experiments were performed. Statistically significant as compared to (a) control, (b) antennapedia homeodomain (HD), (c) BMP2, (d) CK2.3. (p< 0.05).
Figure 2
Figure 2. CK2.3 stimulation of primary calvarial and BMSCs led to increased mineralization
A),B),C) Primary calvarial cells and D),E),F) BMSCs stimulated with PBS, HD (Antennapedia Homeodomain), 40nM BMP2, and 100nM CK2.3. A),D) low resolution, B),E) high resolution of cells. C),F) Quantification of B),E). 3 independent experiments were performed. Statistically significant compared to (a) control, (b) HD, (c) BMP2, (d) CK2.3. (p< 0.05).
Figure 3
Figure 3. Systemic injection of CK2.3 led to increased ALP and Osteocalcin serum levels, while TRACP 5b serum level was decreased
Serum analysis of mice injected with CK2.3, BMP2, and PBS at weeks 0, 2 and 4 for A) ALP, B) osteocalcin, C), TRACP5b. Blood from mice (n=7/group) were pooled and analysis was performed. Statistically significant compared to (a) control, (b) BMP2, (c) CK2.3. (p<0.05).
Figure 4
Figure 4. CK2.3 increased trabecular BMD as measured by pQCT and MicroCT
pQCT and MicroCT analysis of femurs from mice injected with PBS, CK2.3 and BMP2 (n=7/group). A) Trabecular Bone Mineral Density, B) Cortical Bone Mineral Density C) MicroCT analysis and Calcein labelling of bone to determine MAR. (Top panel) Representative rendering of trabecular bone architecture (middle panel) calcein labeling. The white bar in middle panel represents bone growth over time. Statistically significant compared to (a) PBS, (b) BMP2, (c) CK2.3. (p<0.05).
Figure 5
Figure 5. Injection of CK2.3 into mice led to an increase in p-ERK
A) The autofluorescence image of the bone in combination with a nuclear stain was used to determine the cell type (LC=Lining Cells, OT=Osteocytes) and location (MC= Marrow Cavity, TB=Trabecular Bone) within the bone (green, blue). B) Femurs from PBS, BMP2, CK2.3 injected mice (n=3 per group) fluorescently labelled for the nucleus in blue, Smad in red followed by the overlay. C) Femurs from PBS, BMP2, CK2.3 injected mice (n=3 out of 7/group) fluorescently labelled for the nucleus in blue, p-ERK in magenta followed by the overlay. Sections were imaged in the Trabecular Bone (TB) around Marrow cavity where the Lining cells (LC) or the active osteoblasts reside alongside of osteocytes (OT) indicated by arrows. Immunostaining shows increased p-ERK in CK2.3 injected as indicated by the arrows but not Smad1,5 and 8. p-ERK was not observed in PBS, and BMP2 injected mice. Scale bar representing 50μm.
Figure 6
Figure 6. Injection of CK2.3 into B6 mice caused decreased osteoclast activity (A) and osteoclastogenesis (B) in osteoclasts isolated from the spleen
Spleen cells isolated from CK2.3, BMP2, and PBS injected mice are seeded on (A) Bovine femoral bone chips (n = 6 per treatment) and (B) cultured in 1.9cm2 dishes (n = 6 per treatment) using osteoclast differentiation media. Measured for (A) osteoclast activity in pit formations, and (B) number of differentiated osteoclasts and were normalized to the control. At least three independent experiments were performed from spleen cells isolated from mice (n=7/group).

References

    1. Boyle WJ, Simonet WS, Lacey DL. Osteoclast differentiation and activation. Nature. 2003;423:337–342. - PubMed
    1. Ferguson VL, Ayers RA, Bateman TA, et al. Bone development and age-related bone loss in male C57BL/6J mice. Bone. 2003;33:387–398. - PubMed
    1. Marie PJ, Kassem M. Osteoblasts in osteoporosis: past, emerging, and future anabolic targets. Eur J Endocrinol. 2011;165:1–10. - PubMed
    1. Jensen ED, Pham L, Billington CJ, et al. Bone morphogenic protein 2 directly enhances differentiation of murine osteoclast precursors. J Cell Biochem. 2010;109:672–682. - PMC - PubMed
    1. Bragdon B, Thinakaran S, Bonor J, et al. FRET reveals novel protein-receptor interaction of bone morphogenetic proteins receptors and adaptor protein 2 at the cell surface. Biophys J. 2009;97:1428–1435. - PMC - PubMed

Publication types

MeSH terms