. 2015 Mar;63(3):423-40.
doi: 10.1002/glia.22762. Epub 2014 Oct 21.

Redox regulation of NF-κB p50 and M1 polarization in microglia

Affiliations

Redox regulation of NF-κB p50 and M1 polarization in microglia

Thomas Taetzsch et al. Glia. 2015 Mar.

Abstract

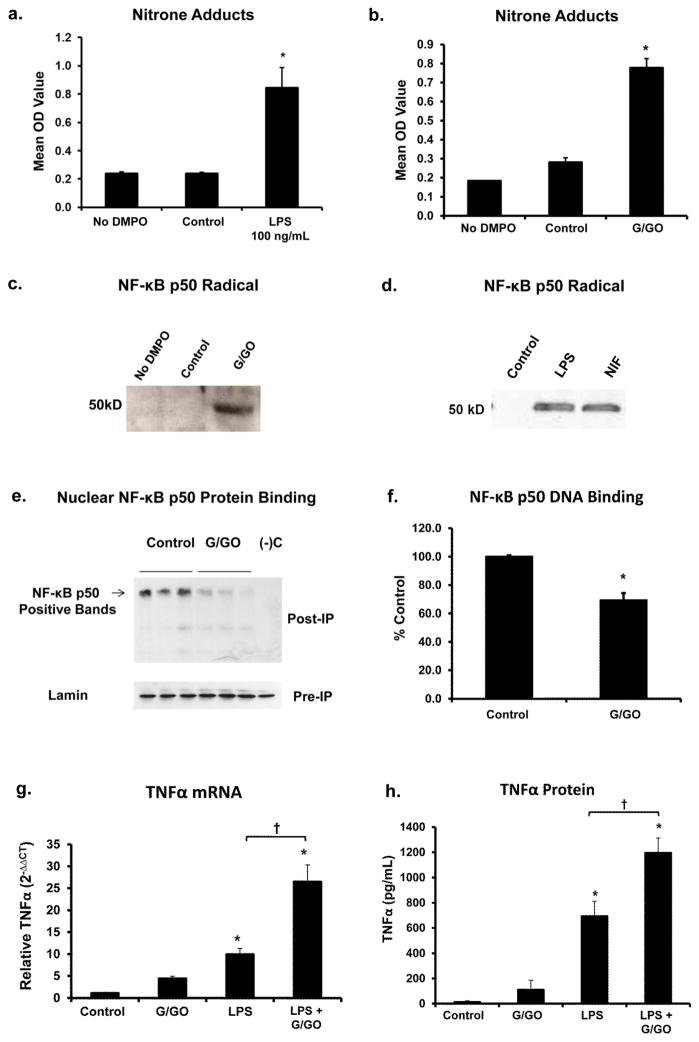
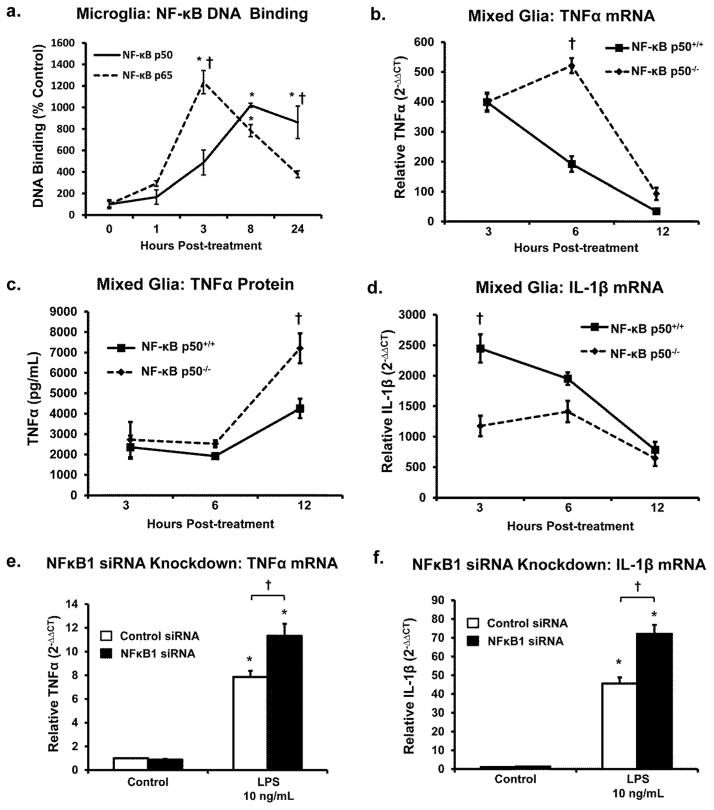
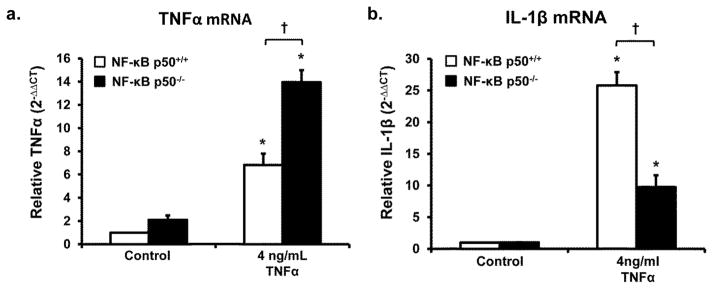
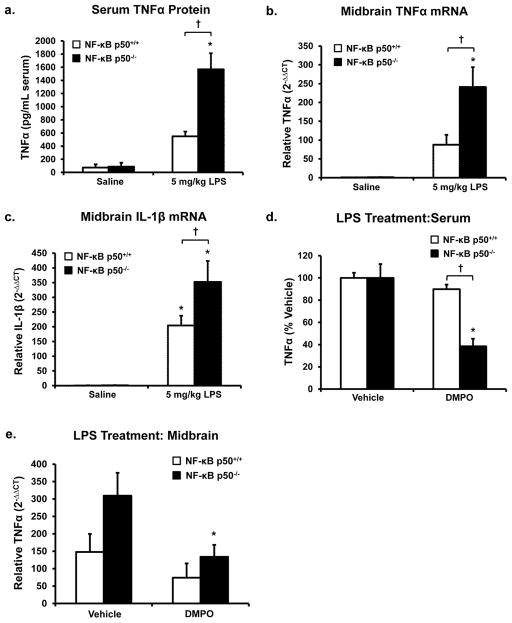
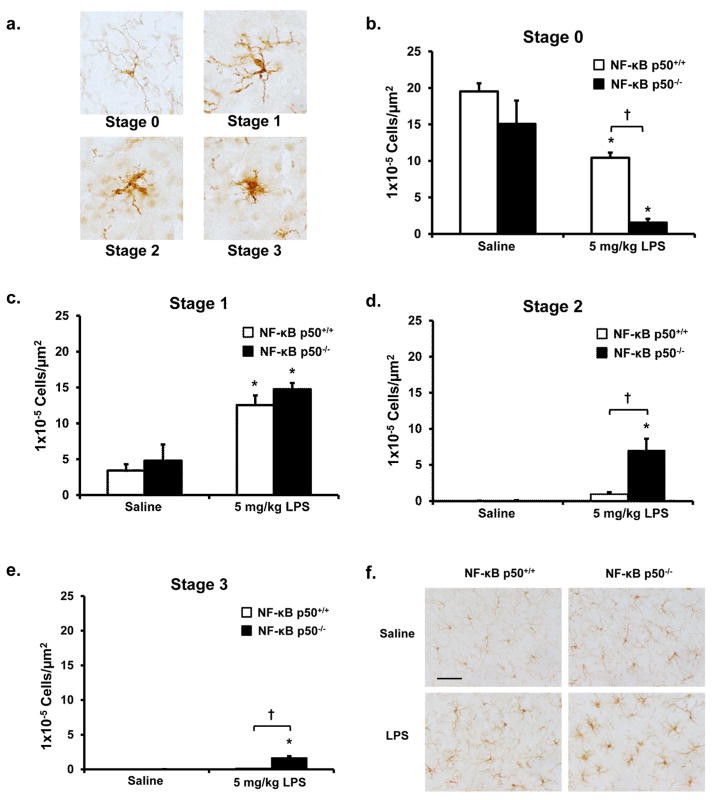
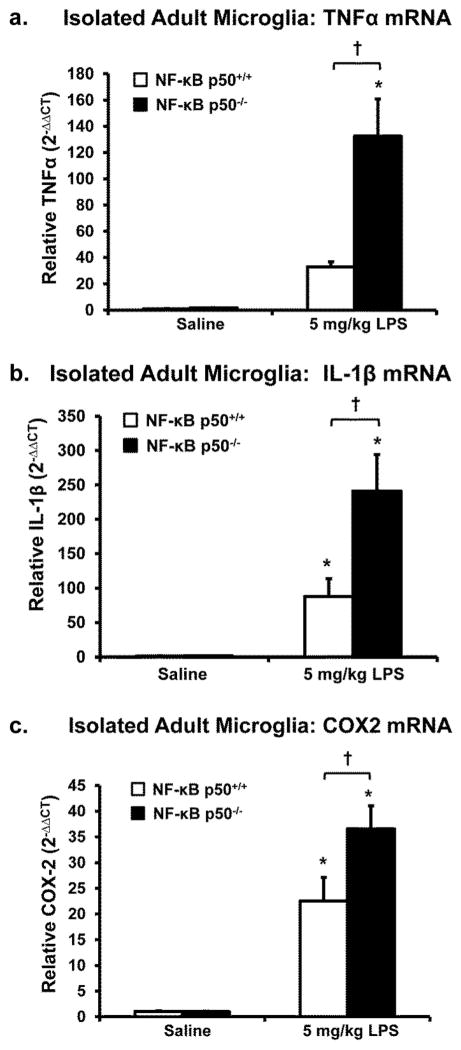
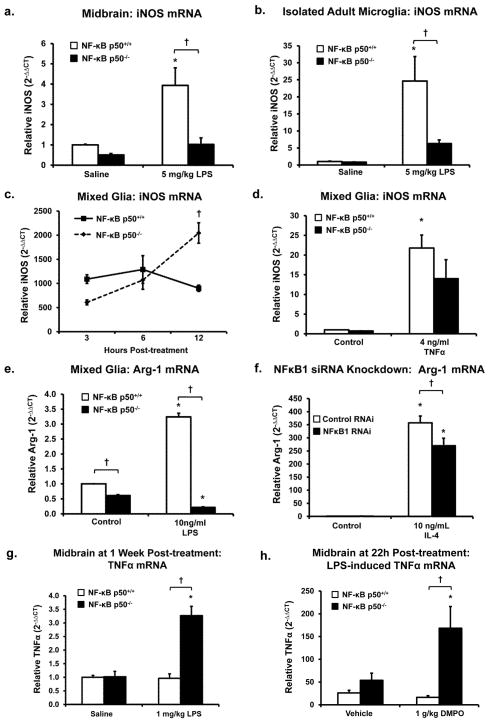
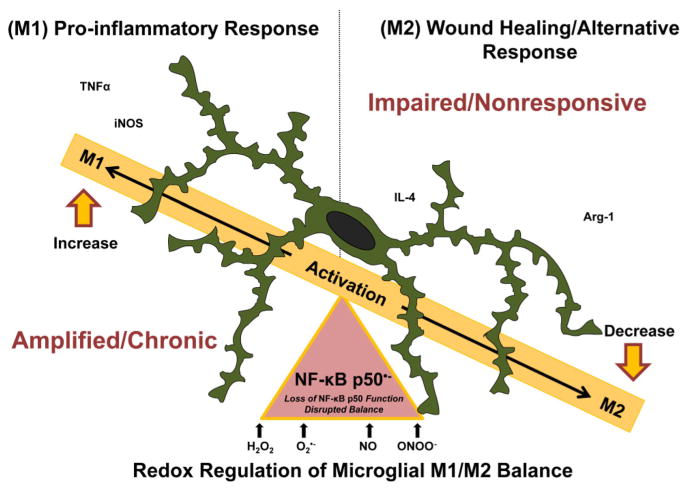
Redox-signaling is implicated in deleterious microglial activation underlying CNS disease, but how ROS program aberrant microglial function is unknown. Here, the oxidation of NF-κB p50 to a free radical intermediate is identified as a marker of dysfunctional M1 (pro-inflammatory) polarization in microglia. Microglia exposed to steady fluxes of H2 O2 showed altered NF-κB p50 protein-protein interactions, decreased NF-κB p50 DNA binding, and augmented late-stage TNFα expression, indicating that H2 O2 impairs NF-κB p50 function and prolongs amplified M1 activation. NF-κB p50(-/-) mice and cultures exhibited a disrupted M2 (alternative) response and impaired resolution of the M1 response. Persistent neuroinflammation continued 1 week after LPS (1 mg/kg, IP) administration in the NF-κB p50(-/-) mice. However, peripheral inflammation had already resolved in both strains of mice. Treatment with the spin-trap DMPO mildly reduced LPS-induced 22 h TNFα in the brain in NF-κB p50(+/+) mice. Interestingly, DMPO failed to reduce and strongly augmented brain TNFα production in NF-κB p50(-/-) mice, implicating a fundamental role for NF-κB p50 in the regulation of chronic neuroinflammation by free radicals. These data identify NF-κB p50 as a key redox-signaling mechanism regulating the M1/M2 balance in microglia, where loss of function leads to a CNS-specific vulnerability to chronic inflammation.

Keywords: CNS; H2O2; NF-κB p50; microglia; redox signaling.


Conflict of interest statement

The authors have no competing interests to declare.

Figures

Figure 1
Figure 1. Microglial ROS result in NF-κB p50 radical formation, impairs NF-κB p50 function, and augments late stage TNFα expression
BV2 microglia pre-loaded with 40mM of the spin-trap DMPO and treated with (a) LPS 100 ng/ml for 3h and (b) glucose/glucose oxidase (G/GO, 5mM, 50 mU/ml) for 30 minutes show elevated levels of DMPO-nitrone adducts, as measured by immuno-spin trapping ELISA, indicating that secondary radicals (proteins and DNA) important for redox signaling are elevated in activated microglia. (c) NF-κB p50 immunoprecipitation and immuno-spin trapping of total cell lysate reveal the presence of the radical form of NF-κB p50 in G/GO treated BV2 cells at 30 minutes post treatment. A representative image is shown. n=3. (d) Primary microglia were treated with 40 mM of the spin-trap DMPO combined with media alone (Control), LPS 10 ng/ml, or neuron injury factors (NIF, from N27 neurons treated with 10 μM MPP+) for 3 h reveal the NF-κB p50 radical is present in microglia activated by diverse M1 stimuli 3 h after treatment. A representative image is shown. n=3. (e) NF -kB p50 co-immunoprecipitation of nuclear lysate and resolution on a non-denaturing gel to preserve disulfide bonds shows modification of NF-kB p50 protein-protein interactions in G/GO activated BV2 cells at 30 minutes post treatment. n=3 (f) G/GO treatment of BV2 nuclear extract collected at 24 h post-LPS 10 ng/ml reduces NF-κB p50 DNA binding as assessed by ELISA. Values are reported as mean percent of control ± s.e.m. n=3. G/GO augments TNFα (g) mRNA and (h) protein expression at 24 h in BV2 cells treated with repeated LPS treatments (0 and 21 h). Values are reported as mean percent of control ± s.e.m. n=3. mRNA expression was evaluated by quantitative RT-PCR, values were normalized to GAPDH using the 2−ΔΔCT method. An asterisk indicates significant difference (P<0.05) from control.
Figure 2
Figure 2. Loss of NF-κB p50 shifts the M1 kinetic response to LPS in CNS cells
(a) Analysis of nuclear extracts from BV2 microglia stimulated with 10ng/ml LPS collected at 1, 3, 8 and 24 h post-treatment shows divergent NF-κB p50 and NF-κB p65 DNA binding kinetics over time and predominant NF-κB p50 DNA binding during the later stages of the pro-inflammatory response. Values are reported as mean percent of 0 h time point ± s.e.m. n=3. Primary NF-κB p50+/+ and NF-κB p50−/− mixed glia cultures were treated with LPS 10 ng/ml and (b) TNFα mRNA, (c) TNFα protein, and (d) IL-1β mRNA expression were assessed. BV2 microglia reverse transfected with control or NFκB1 siRNA for 72 h showed enhanced (e) TNFα and (f) IL-1β mRNA expression at 6h post-LPS 10 ng/ml treatment. mRNA expression was evaluated by quantitative RT-PCR, values were normalized to β-actin or GAPDH using the 2−ΔΔCT method and were reported as mean expression ± s.e.m. Protein expression was evaluated by a commercially available ELISA and reported as the mean concentration ± s.e.m. An asterisk indicates significant difference (P<0.05) from control and an † indicates a difference between siRNA treatments or genotype.
Figure 3
Figure 3. Loss of NF-κB p50 function modulates the M1 response to TNFα in CNS cells
Primary NF-κB p50+/+ and NF-κB p50−/− mixed-glia cultures were treated with TNFα (4 ng/ml). (a) TNFα and (b) IL-1β mRNA expression were evaluated at 6h post-treatment by quantitative RT-PCR. Values are normalized to β-actin using the 2−ΔΔCT method. An asterisk indicates significant difference (P<0.05) from control and an † indicates a difference between mouse strains. n=3
Figure 4
Figure 4. Peripheral and central inflammation in NF-κB p50−/− mice
NF-κB p50+/+ and NF-κB p50−/− mice were injected with saline or LPS (5 mg/kg, IP) to investigate the effects of loss of NF-κB p50 function on neuroinflammation. Serum and midbrain tissue were collected following sacrifice at 3h post-injection. (a) Circulating serum TNFα levels were measured with ELISA. Neuroinflammation in the midbrain was assessed by measuring (b) TNFα, and (c) IL-1β through quantitative RT-PCR. To discern the role of NF-κB p50 in how free radicals regulate the LPS response, DMPO (1 g/kg, IP) or vehicle (0.9% saline) was administered to NF-κB p50+/+ and NF-κB p50−/− mice 1h before and 1h after LPS (5mg/kg IP) injection. Peripheral inflammation was assessed at 3h post-LPS injection by measuring circulating serum TNFα in (d) NF-κB p50+/+ and (e) NF-κB p50−/− mice with ELISA. Neuroinflammation in the midbrain was assessed at 3h post-LPS injection by TNFα expression in (f) NF-κB p50+/+ and (g) NF-κB p50−/− mice through quantitative RT-PCR. Values are normalized to β-actin or GAPDH using the 2−ΔΔCT method and are reported as mean expression ± s.e.m. An asterisk indicates significant difference (P<0.05) from control and an † indicates a difference between mouse strains. n=3–5
Figure 5
Figure 5. NF-κB p50−/− mice have enhanced activated microglia morphology in response to peripheral LPS injection
NF-κB p50+/+ and NF-κB p50−/− mice were injected with saline or LPS (5 mg/kg, IP) to discern the impact of loss of NF-κB p50 function on microglia morphology in vivo. (a) Images (60X) depict representative examples of microglial activation stages. Microglia within the substantia nigra pars compacta (in the midbrain) were stained with IBA1 and categorized into stages of activation. The relative number of microglia at 3 h post injection within (b) Stage 0, (c) Stage 1, (d) Stage 2, and (e) Stage 3 was quantified by the fractionator method. Values are reported as mean cells/μm2 ± s.e.m. of 3 coronal sections (40 μm) per animal (n=3). An asterisk indicates significant difference (P<0.05) from control and an † indicates a difference between mouse strains. (f) Representative images are 40X and the scale bar depicts 50 μm.
Figure 6
Figure 6. Adult NF-κB p50−/− microglia display elevated M1 activation in response to peripheral LPS
NF-κB p50+/+ and NF-κB p50−/− mice were injected with saline or LPS (5 mg/kg, IP) and microglia were isolated from the whole brain with CD11b microbeads at 3h post-injection. Isolated microglia were assessed for differences in (a) TNFα, (b) IL-1β, and (c) COX-2 mRNA expression through quantitative RT-PCR. Values are normalized to GAPDH using the 2−ΔΔCT method and are reported as mean expression ± s.e.m. An asterisk indicates significant difference (P<0.05) from control and an † indicates a difference between mouse strains. n=6 for all panels except a (n=3).
Figure 7
Figure 7. Loss of NF-κB p50 function inhibits the M2 response and impairs M1 resolution in the brain
iNOS mRNA expression is decreased in (a) midbrain and (b) CD11b microbead isolated microglia of NF-κB p50−/− mice at 3 h post-injection LPS (5 mg/kg IP). (c) Evaluation of iNOS gene expression across time shows that primary NF-κB p50−/− mixed glia cultures have enhanced iNOS expression only at the later time point, 12 h post-LPS 10 ng/ml treatment. (d) Consistent with these findings, no genotype differences in iNOS gene expression were seen at 3 h in response to TNFα in primary mixed glia cultures. (e) The M2 marker Arginase-1 is downregulated in primary NF-κB p50−/− mixed glia cultures at 12 h post-LPS 10 ng/ml treatment. (f) BV2 microglia reverse transfected with NFκB1 siRNA for 72 h show reduced 12 h Arginsae-1 expression in response to IL-4 (10 ng/ml). (g) NF-κB p50−/− mice injected with LPS (1 mg/kg IP) continue to display elevated TNFα expression in the midbrain at 1 week post-injection. (h) DMPO (1g/kg IP) injected at 8,16 and 20h post -LPS (5mg/kg IP) treatment mildly reduced midbrain TNFα expression in NF-κB p50+/+ mice yet enhanced TNFα expression in NF-κB p50−/− mice at 22h post-LPS injection. Gene expression evaluated through quantitative RT-PCR with values normalized to β-actin or GAPDH using the 2−ΔΔCT method and reported as mean expression ± s.e.m. An asterisk indicates significant difference (P<0.05) from control and an † indicates a difference between mouse strains. n=3 for all panels except b (n=5), f (n=9) and g (n=4).
Figure 8
Figure 8. NF-κB p50 is a redox signaling switch for M1 polarization/dysregulated activation
Microglia, the resident macrophages in the central nervous system (CNS), are mandatory for normal CNS physiology and health. These sentinels detect and respond to a diverse array of stimuli in the brain, including environmental toxins, bacterial toxins, cytokines, neuron damage, and disease proteins, where the activation state is traditionally defined on a spectrum of pro-inflammatory (M1) or alternative (M2) responses. M1 activation is characterized by the upregulation of pro-inflammatory mediators (ex. TNFα and iNOS) and in normal physiology is followed by the M2 response (ex. Arg-1 & IL-4) that is important for wound healing and M1 resolution. In the case of disease, a deleterious microglial phenotype can occur when the response is dysregulated, tipping the balance to a chronically activated and polarized M1 phenotype. M1 polarization is defined by an enhanced pro-inflammatory response, impaired pro-inflammatory resolution, and a deficit in the alternative response (M2 response). Here, we demonstrate that ROS (i.e. H2O2) disrupt this microglial activation balance by perturbing the kinetics of the M1/M2 shift, favoring chronic M1 polarization through the loss of NF-κB p50 function, a process characterized by the presence of the NF-κB p50 radical (NF-κB p50•−). Further, we demonstrate that: this loss of NF-κB p50 function results in an enhanced and chronic neuroinflammation that persists long after the initial peripheral instigating immune signal has abated. These findings support that NF-κB p50 may be critical for how radicals regulate chronic TNFα production in the brain, and that there is a CNS-specific vulnerability to chronic inflammation through this mechanism.

References

    1. Aguzzi A, Barres BA, Bennett ML. Microglia: scapegoat, saboteur, or something else? Science. 2013;339:156–61. - PMC - PubMed
    1. Baer M, Dillner A, Schwartz RC, Sedon C, Nedospasov S, Johnson PF. Tumor necrosis factor alpha transcription in macrophages is attenuated by an autocrine factor that preferentially induces NF-kappaB p50. Mol Cell Biol. 1998;18:5678–89. - PMC - PubMed
    1. Bal-Price A, Brown GC. Inflammatory neurodegeneration mediated by nitric oxide from activated glia-inhibiting neuronal respiration, causing glutamate release and excitotoxicity. J Neurosci. 2001;21:6480–91. - PMC - PubMed
    1. Block ML, Wu X, Pei Z, Li G, Wang T, Qin L, Wilson B, Yang J, Hong JS, Veronesi B. Nanometer size diesel exhaust particles are selectively toxic to dopaminergic neurons: the role of microglia, phagocytosis, and NADPH oxidase. FASEB J. 2004;18:1618–20. - PubMed
    1. Block ML, Zecca L, Hong JS. Microglia-mediated neurotoxicity: uncovering the molecular mechanisms. Nat Rev Neurosci. 2007;8:57–69. - PubMed

Publication types

MeSH terms