

Comparison of library preparation methods reveals their impact on interpretation of metatranscriptomic data
- PMID: 25331572
- PMCID: PMC4213505
- DOI: 10.1186/1471-2164-15-912
Comparison of library preparation methods reveals their impact on interpretation of metatranscriptomic data
Abstract
Background: Metatranscriptomics is rapidly expanding our knowledge of gene expression patterns and pathway dynamics in natural microbial communities. However, to cope with the challenges of environmental sampling, various rRNA removal and cDNA synthesis methods have been applied in published microbial metatranscriptomic studies, making comparisons arduous. Whereas efficiency and biases introduced by rRNA removal methods have been relatively well explored, the impact of cDNA synthesis and library preparation on transcript abundance remains poorly characterized. The evaluation of potential biases introduced at this step is challenging for metatranscriptomic samples, where data analyses are complex, for example because of the lack of reference genomes.
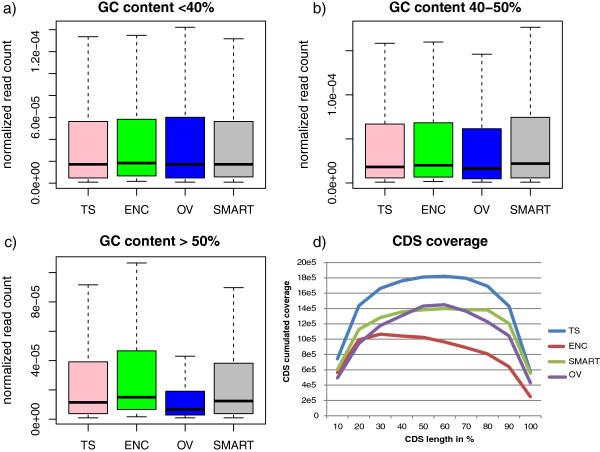
Results: Herein, we tested four cDNA synthesis and Illumina library preparation protocols on a simplified mixture of total RNA extracted from four bacterial species. In parallel, RNA from each microbe was tested individually. cDNA synthesis was performed on rRNA depleted samples using the TruSeq Stranded Total RNA Library Preparation, the SMARTer Stranded RNA-Seq, or the Ovation RNA-Seq V2 System. A fourth experiment was made directly from total RNA using the Encore Complete Prokaryotic RNA-Seq. The obtained sequencing data were analyzed for: library complexity and reproducibility; rRNA removal efficiency and bias; the number of genes detected; coverage uniformity; and the impact of protocols on expression biases. Significant variations, especially in organism representation and gene expression patterns, were observed among the four methods. TruSeq generally performed best, but is limited by its requirement of hundreds of nanograms of total RNA. The SMARTer method appears the best solution for smaller amounts of input RNA. For very low amounts of RNA, the Ovation System provides the only option; however, the observed biases emphasized its limitations for quantitative analyses.
Conclusions: cDNA and library preparation methods may affect the outcome and interpretation of metatranscriptomic data. The most appropriate method should be chosen based on the available quantity of input RNA and the quantitative or non-quantitative objectives of the study. When low amounts of RNA are available, as in most metatranscriptomic studies, the SMARTer method seems to be the best compromise to obtain reliable results. This study emphasized the difficulty in comparing metatranscriptomic studies performed using different methods.
Figures


References
-
- Hewson I, Poretsky RS, Beinart RA, White AE, Shi T, Bench SR, Moisander PH, Paerl RW, Tripp HJ, Montoya JP, Moran MA, Zehr JP. In situ transcriptomic analysis of the globally important keystone N2-fixing taxon Crocosphaera watsonii. ISME J. 2009;3(5):618–631. doi: 10.1038/ismej.2009.8. - DOI - PubMed
Publication types
MeSH terms
Substances
LinkOut - more resources
Full Text Sources
Other Literature Sources
Medical
