. 2014 Nov 4;111(44):15635-40.
doi: 10.1073/pnas.1418377111. Epub 2014 Oct 20.

Volta potential phase plate for in-focus phase contrast transmission electron microscopy

Affiliations

Volta potential phase plate for in-focus phase contrast transmission electron microscopy

Radostin Danev et al. Proc Natl Acad Sci U S A. .

Abstract

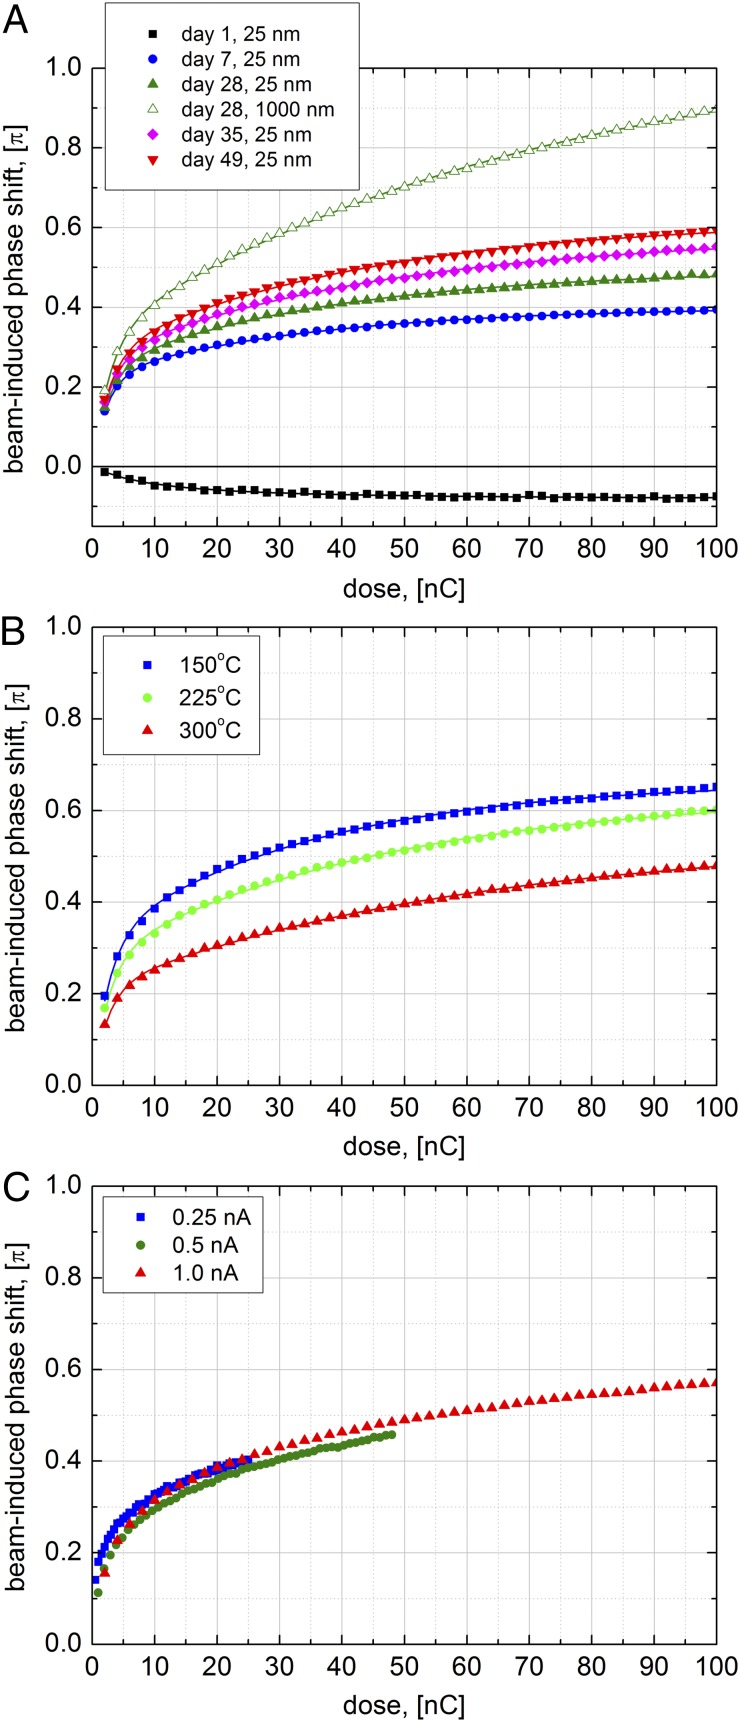
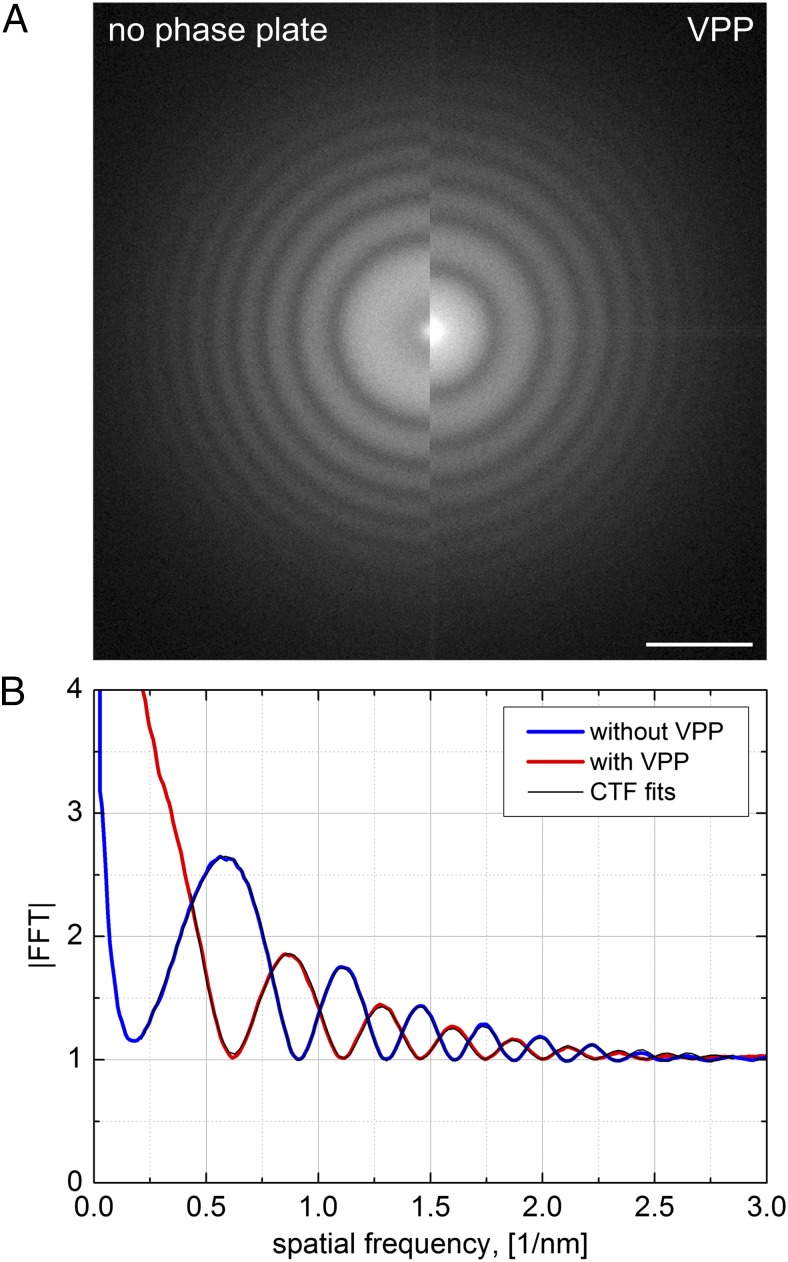
We describe a phase plate for transmission electron microscopy taking advantage of a hitherto-unknown phenomenon, namely a beam-induced Volta potential on the surface of a continuous thin film. The Volta potential is negative, indicating that it is not caused by beam-induced electrostatic charging. The film must be heated to ∼ 200 °C to prevent contamination and enable the Volta potential effect. The phase shift is created "on the fly" by the central diffraction beam eliminating the need for precise phase plate alignment. Images acquired with the Volta phase plate (VPP) show higher contrast and unlike Zernike phase plate images no fringing artifacts. Following installation into the microscope, the VPP has an initial settling time of about a week after which the phase shift behavior becomes stable. The VPP has a long service life and has been used for more than 6 mo without noticeable degradation in performance. The mechanism underlying the VPP is the same as the one responsible for the degradation over time of the performance of thin-film Zernike phase plates, but in the VPP it is used in a constructive way. The exact physics and/or chemistry behind the process causing the Volta potential are not fully understood, but experimental evidence suggests that radiation-induced surface modification combined with a chemical equilibrium between the surface and residual gases in the vacuum play an important role.

Keywords: TEM; Volta potential; cryo-EM; phase contrast; phase plate.


Conflict of interest statement

Conflict of interest statement: B.B. is a full-time employee of FEI.

Figures

Fig. 1.
Fig. 1.
Beam-induced phase shift (BIPS) as a function of the total dose for a 12-nm–thick amorphous carbon film. The phase shift plotted is that of the central beam relative to the scattered beams and a positive value means phase advance. Experimental data are shown with symbols; the solid lines represent double asymptotic exponential fits. (A) BIPS curves for a film heated to 225 °C, beam current of 1 nA. The legend shows the film age, measured from the moment it was inserted into the microscope, and the beam diameter on the film (25 nm, on-plane; 1,000 nm, off-plane). (B) BIPS curves on-plane (25-nm beam diameter) at different temperatures; film age was 51 d, and beam current was 1 nA. The film was kept for ∼24 h at 150 °C before the first measurement and then for ∼1 h at the other two temperatures before their respective measurements. (C) BIPS curves on-plane (25-nm beam diameter) with different beam currents; film age was 52 d, and temperature was 225 °C.
Fig. 2.
Fig. 2.
Low-magnification images of 1-μm beam spots on 12-nm–thick amorphous carbon film kept at 225 °C. The spots were created with a beam current of 1 nA and a dose of 100 nC (100 s of irradiation). (A and B) The same spot observed with (A) 15-mm underfocus and (B) in-focus. (C and D) A beam spot (black arrow) next to a FIB-produced hole in the film (white arrow). The first image (C) was taken immediately after the spot was created. The second image (D) was taken 5 d later. (E) A freshly created beam spot (white arrow) next to beam spots created more than 10 d earlier (black arrows). Defocus for C–E: 50-mm underfocus. (Scale bars: 5 μm.)
Fig. 3.
Fig. 3.
Long-term behavior of beam-created spots on amorphous carbon film. The average intensity of a 0.5-μm beam spot was measured relative to the background and then normalized by the original spot intensity. All spots were created at 225 °C after which the temperature was set to the indicated in the legend temperature for each measurement. The legend also indicates whether the anticontamination device (ACD) was used (ON) or not (OFF) during the relaxation period.
Fig. 4.
Fig. 4.
(A) Side-by-side FFTs of high-magnification images taken without and with a VPP. The CTFs demonstrate a very good complementary match with no deformation. (B) Rotationally averaged and background normalized profiles of the FFTs in A. Both profiles fit very well the theoretical CTF model (black lines), which confirms the absence of electrostatic charging distortion. The VPP CTF (red line) indicates about 18% signal loss compared with that without a phase plate (blue line). Defocus: 500 nm. (Scale bar: 1 nm−1.)
Fig. 5.
Fig. 5.
Images of lacey carbon film acquired with (A) a ZPP and (C) a VPP. The image in B is a fringe reduction software-filtered version of the ZPP image in A. (Scale bar: 20 nm.)
Fig. 6.
Fig. 6.
Cryo-EM images of vitrified worm sperm flagellum (A) without and (B) with a VPP. The black solid arrows indicate microtubules inside the flagellum. The black dashed arrows point to proteins on the outside and the inside of the membrane. The white arrows point at a gold fiducial marker and a contaminant. Defocus: (A) 5-μm underfocus, (B) close to focus. (Scale bar: 100 nm.)

References

    1. Danev R, Nagayama K. Transmission electron microscopy with Zernike phase plate. Ultramicroscopy. 2001;88(4):243–252. - PubMed
    1. Nagayama K, Danev R. Phase contrast electron microscopy: Development of thin-film phase plates and biological applications. Philos Trans R Soc Lond B Biol Sci. 2008;363(1500):2153–2162. - PMC - PubMed
    1. Walter A, et al. Practical aspects of Boersch phase contrast electron microscopy of biological specimens. Ultramicroscopy. 2012;116:62–72. - PubMed
    1. Frindt N, et al. In-focus electrostatic Zach phase plate imaging for transmission electron microscopy with tunable phase contrast of frozen hydrated biological samples. Microsc Microanal Canada. 2014;20(1):175–183. - PubMed
    1. Edgcombe CJ, et al. Characterisation of ferromagnetic rings for Zernike phase plates using the Aharonov-Bohm effect. Ultramicroscopy. 2012;120:78–85. - PubMed

Publication types