

Hypertension in the United States, 1999 to 2012: progress toward Healthy People 2020 goals
- PMID: 25332288
- PMCID: PMC4221549
- DOI: 10.1161/CIRCULATIONAHA.114.010676
Hypertension in the United States, 1999 to 2012: progress toward Healthy People 2020 goals
Abstract
Background: To reduce the cardiovascular disease burden, Healthy People 2020 established US hypertension goals for adults to (1) decrease the prevalence to 26.9% and (2) raise treatment to 69.5% and control to 61.2%, which requires controlling 88.1% on treatment.
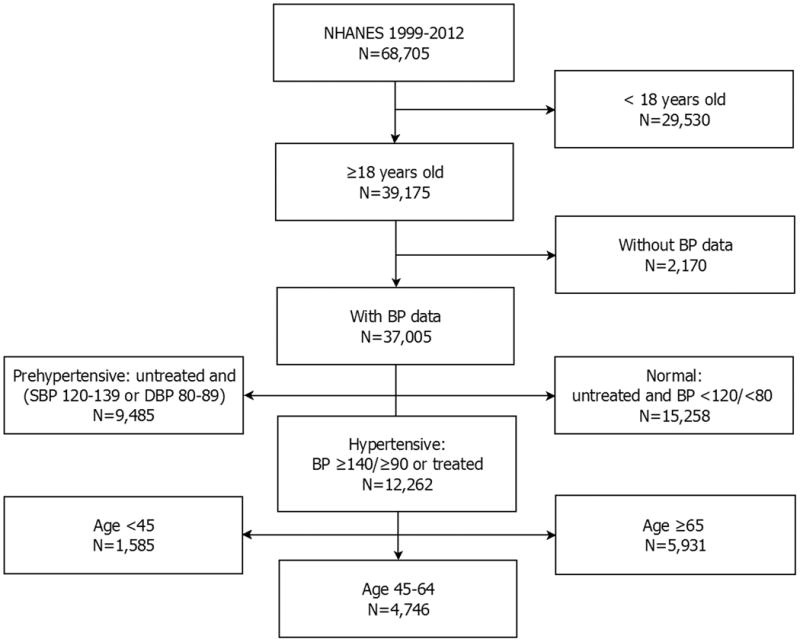
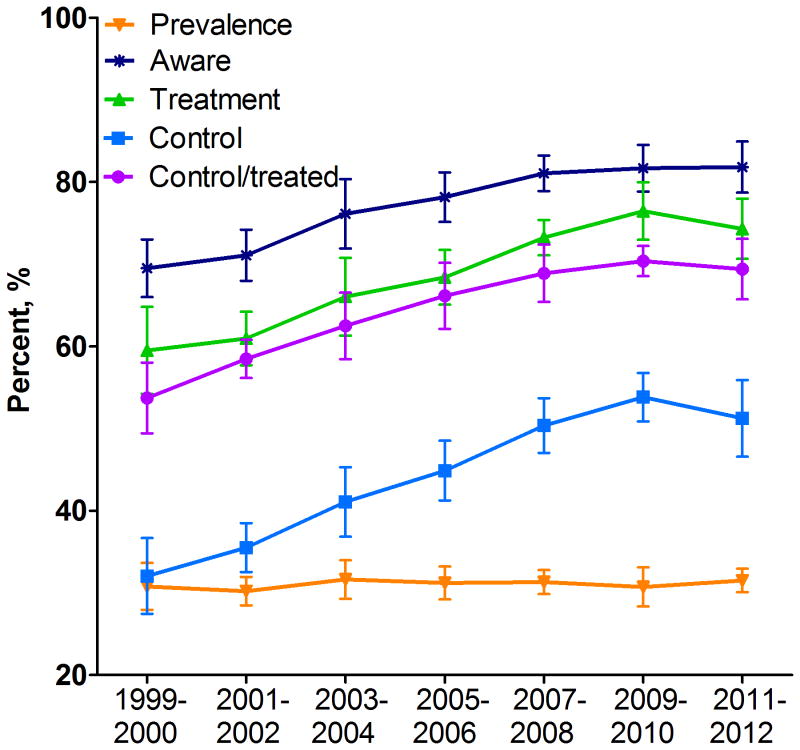
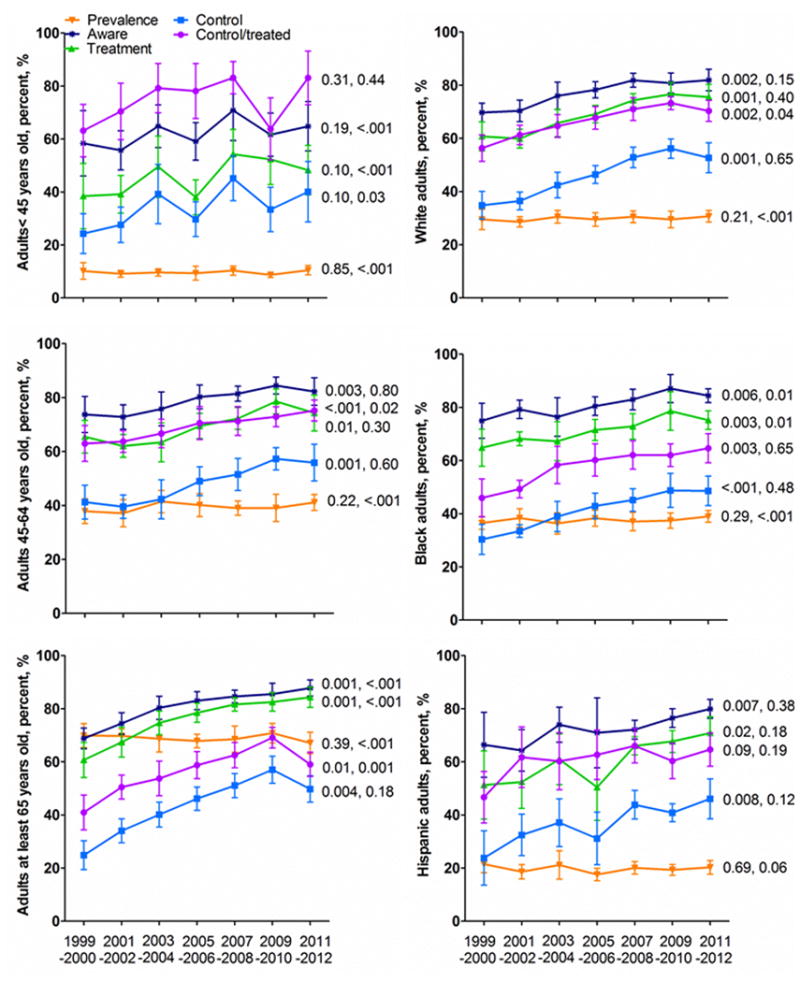
Methods and results: To assess the current status and progress toward these Healthy People 2020 goals, time trends in National Health and Nutrition Examination Surveys 1999 to 2012 data in 2-year blocks were assessed in adults ≥18 years of age age-adjusted to US 2010. From 1999 to 2000 to 2011 to 2012, prevalent hypertension was unchanged (30.1% versus 30.8%, P=0.32). Hypertension treatment (59.8% versus 74.7%, P<0.001) and proportion of treated adults controlled (53.3%-68.9%, P=0.0015) increased. Hypertension control to <140/<90 mm Hg rose every 2 years from 1999 to 2000 to 2009 to 2010 (32.2% versus 53.8%, P<0.001) before declining to 51.2% in 2011 to 2012. Modifiable factor(s) significant in multivariable logistic regression modeling include: (1) increasing body mass index with prevalent hypertension (odds ratio [OR], 1.44); (2) lack of health insurance (OR, 1.68) and <2 healthcare visits per year (OR, 4.24) with untreated hypertension; (3) healthcare insurance (OR, 1.69), ≥2 healthcare visits per year (OR, 3.23), and cholesterol treatment (OR, 1.90) with controlled hypertension.
Conclusions: The National Health and Nutrition Examination Survey 1999 to 2012 analysis suggests that Healthy People 2020 goals for hypertension ([1] prevalence shows no progress, [2] treatment was exceeded, and [3] control) have flattened below target. Findings are consistent with evidence that (1) obesity prevention and treatment could reduce prevalent hypertension, and (2) healthcare insurance, ≥2 healthcare visits per year, and guideline-based cholesterol treatment could improve hypertension control.
Keywords: Healthy People Programs; hypertension; nutrition surveys; population characteristics.
© 2014 American Heart Association, Inc.
Conflict of interest statement
Figures
Comment in
-
Hypertension and Healthy People 2020: the role of health insurance expansion.Circulation. 2014 Nov 4;130(19):1674-5. doi: 10.1161/CIRCULATIONAHA.114.012874. Epub 2014 Oct 20. Circulation. 2014. PMID: 25366832 No abstract available.
References
-
- Frieden TR, Berwick DM. The “Million Hearts” initiative—preventing heart attacks and strokes. N Engl J Med. 2011;365:e27. - PubMed
-
- Healthy People 2010. [accessed 19 March 2014];12: Heart disease and stroke. http://www.cdc.gov/dhdsp/docs/hp2010.pdf.
-
- Egan BM, Zhao Y, Axon RN. US trends in prevalence, awareness, treatment, and control of hypertension, 1988–2008. JAMA. 2010;303:2043–2050. - PubMed
Publication types
MeSH terms
Substances
Grants and funding
LinkOut - more resources
Full Text Sources
Other Literature Sources
Medical
