. 2014 Sep 23:2:e561.
doi: 10.7717/peerj.561. eCollection 2014.

Removing batch effects for prediction problems with frozen surrogate variable analysis

Affiliations

Removing batch effects for prediction problems with frozen surrogate variable analysis

Hilary S Parker et al. PeerJ. .

Abstract

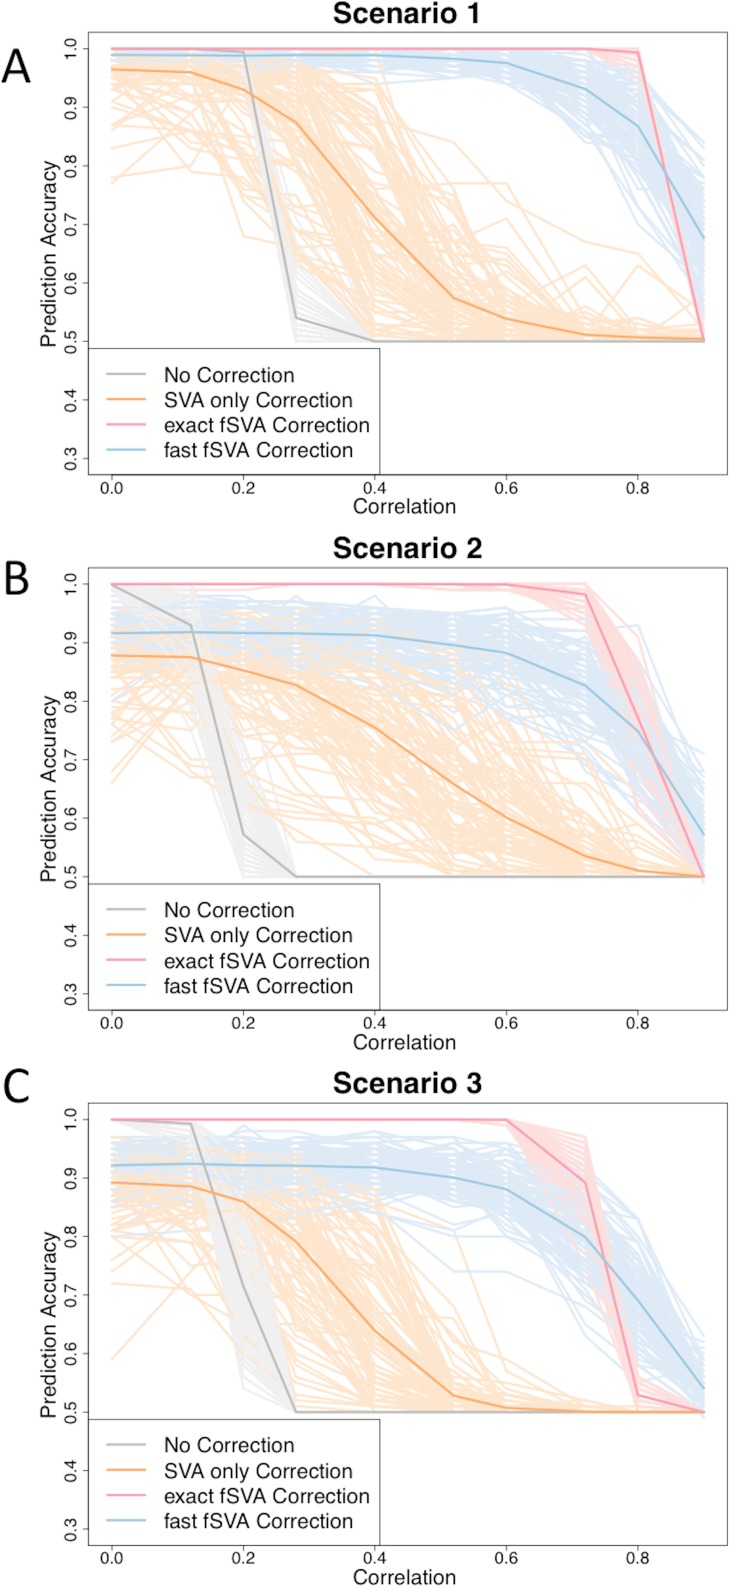
Batch effects are responsible for the failure of promising genomic prognostic signatures, major ambiguities in published genomic results, and retractions of widely-publicized findings. Batch effect corrections have been developed to remove these artifacts, but they are designed to be used in population studies. But genomic technologies are beginning to be used in clinical applications where samples are analyzed one at a time for diagnostic, prognostic, and predictive applications. There are currently no batch correction methods that have been developed specifically for prediction. In this paper, we propose an new method called frozen surrogate variable analysis (fSVA) that borrows strength from a training set for individual sample batch correction. We show that fSVA improves prediction accuracy in simulations and in public genomic studies. fSVA is available as part of the sva Bioconductor package.

Keywords: Batch effects; Database; Genomics; Machine learning; Prediction; Statistics; Surrogate variable analysis.


Figures

Figure 1
Figure 1. fSVA improves prediction accuracy of simulated datasets.
We created simulated datasets (consisting of a database and new samples) using model (2) and tested the prediction accuracy of these using R. For each simulated data set we performed either exact fSVA correction, fast fSVA correction, SVA correction on the database only, or no correction. We performed 100 iterations on each simulation scenario described in Table 1. We performed the simulation for a range of potential values for the correlation between the outcome we were predicting and the batch effects (x-axis in each plot). These plots show the 100 iterations, as well as the average trend line for each of the four methods investigated.

References

    1. Akey JM, Biswas S, Leek JT, Storey JD. On the design and analysis of gene expression studies in human populations. Nature Genetics. 2007;39(7):807–808. doi: 10.1038/ng0707-807. - DOI - PubMed
    1. Baggerly KA, Morris JS, Coombes KR. Reproducibility of SELDI-TOF protein patterns in serum: comparing datasets from different experiments. Bioinformatics. 2004;20(5):777–785. doi: 10.1093/bioinformatics/btg484. - DOI - PubMed
    1. Baggerly KA, Coombes KR, Morris JS. Bias, randomization, and ovarian proteomic data: a reply to “producers and consumers”. Cancer Informatics. 2003;1:9–14. - PMC - PubMed
    1. Buja A, Eyuboglu N. Remarks on parallel analysis. Multivariate Behavioral Research. 1992;27(4):509–540. doi: 10.1207/s15327906mbr2704_2. - DOI - PubMed
    1. Chan IS, Ginsburg GS. Personalized medicine: progress and promise. Annual Review of Genomics and Human Genetics. 2011;12:217–244. doi: 10.1146/annurev-genom-082410-101446. - DOI - PubMed

LinkOut - more resources