. 2014 Jun 26;4(2):109-22.
doi: 10.5662/wjm.v4.i2.109.

Choosing inclusion criteria that minimize the time and cost of clinical trials

Affiliations

Choosing inclusion criteria that minimize the time and cost of clinical trials

Charles F Babbs. World J Methodol. .

Abstract

Aim: To present statistical tools to model and optimize the cost of a randomized clinical trial as a function of the stringency of patient inclusion criteria.

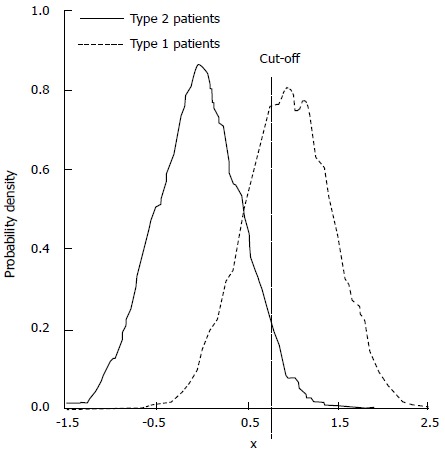
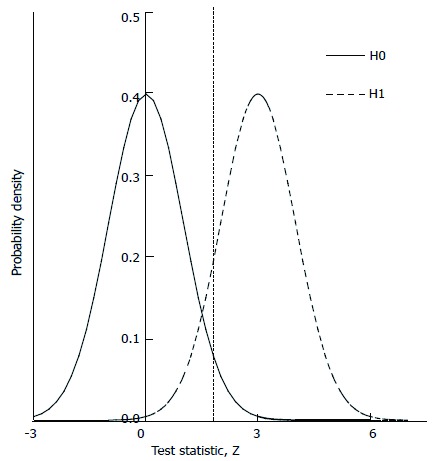
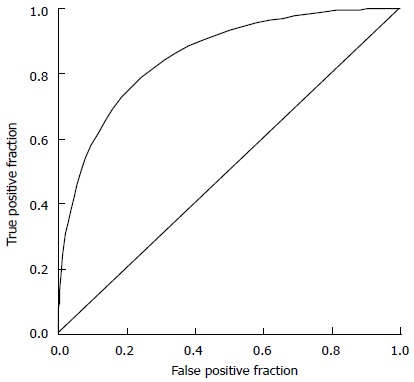
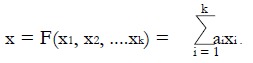
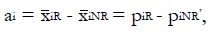
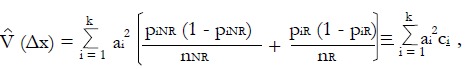
Methods: We consider a two treatment, dichotomous outcome trial that includes a proportion of patients who are strong responders to the tested intervention. Patients are screened for inclusion using an arbitrary number of test results that are combined into an aggregate suitability score. The screening score is regarded as a diagnostic test for the responsive phenotype, having a specific cutoff value for inclusion and a particular sensitivity and specificity. The cutoff is a measure of stringency of inclusion criteria. Total cost is modeled as a function of the cutoff value, number of patients screened, the number of patients included, the case occurrence rate, response probabilities for control and experimental treatments, and the trial duration required to produce a statistically significant result with a specified power. Regression methods are developed to estimate relevant model parameters from pilot data in an adaptive trial design.

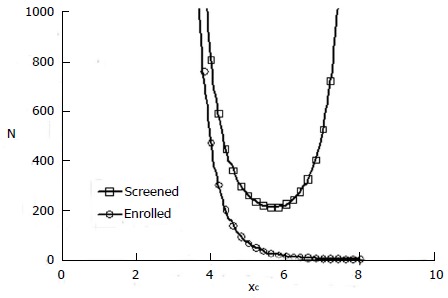
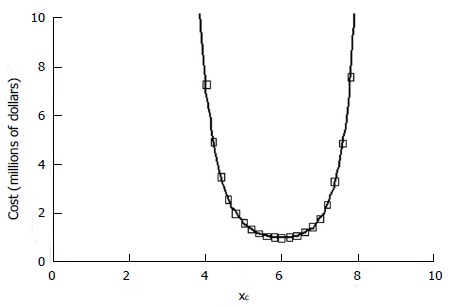
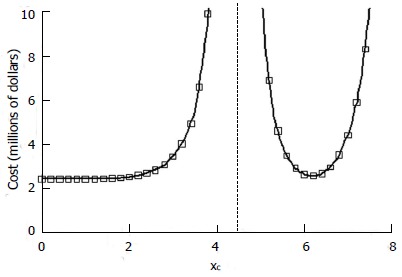
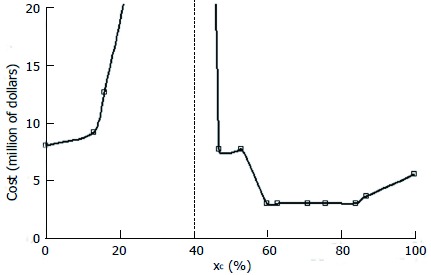
Results: The patient numbers and total cost are strongly related to the choice of the cutoff for inclusion. Clear cost minimums exist between 5.6 and 6.1 on a representative 10-point scale of exclusiveness. Potential cost savings for typical trial scenarios range in millions of dollars. As the response rate for controls approaches 50%, the proper choice of inclusion criteria can mean the difference between a successful trial and a failed trial.

Conclusion: Early formal estimation of optimal inclusion criteria allows planning of clinical trials to avoid high costs, excessive delays, and moral hazards of Type II errors.

Keywords: Adaptive trial designs; Biomarkers; Clinical trials; Device; Drug therapy; Ethics; Methodology; Optimal allocation; Personalized medicine; Sequential design.


Figures

Figure 1
Figure 1
Separation of patient response phenotypes to a tested treatment according to an aggregate predictive variable, x. The fraction of type 1 responders to the right of the cutoff is the true positive fraction. The fraction of type 2 non-responders to the right of the cutoff is the false positive fraction. In this general example the units of x are arbitrary.
Math 10
Math 10
Math(A1).
Math 11
Math 11
Math(A1).
Figure 2
Figure 2
Calculation of power from probability density distributions for the null hypothesis (H0) and for an alternative hypothesis (H1). The dashed line shows critical value for significance (1.96 for two-tailed P < 0.05). The area under the thick curve to the right of the critical value is the statistical power of the test of H0.
Math 12
Math 12
Math(A1).
Math 13
Math 13
Math(A1).
Math 14
Math 14
Math(A1).
Math 15
Math 15
Math(A1).
Math 16
Math 16
Math(A1).
Math 17
Math 17
Math(A1).
Math 18
Math 18
Math(A1).
Math 19
Math 19
Math(A1).
Math 20
Math 20
Math(A1).
Math 21
Math 21
Math(A1).
Math 22
Math 22
Math(A1).
Math 23
Math 23
Math(A1).
Figure 3
Figure 3
A sample receiver operating characteristic curve for a hypothetical screening test. In this example type 1 patients had screening scores, x, with a mean of 5.5 and a standard deviation of 1; type 2 patients had screening scores, x, with a mean of 4 and a standard deviation of 1. As the cutoff value xc is swept from 1.0 toward zero, a family of true positive and false positive fractions is created to generate the receiver operating characteristic (ROC) curve.
Figure 4
Figure 4
Numbers of patients screened and enrolled in a model study of heterogeneous responders having a statistically significant positive result. For this model the proportion of type 1, good responders q = 0.2, the response probability for type 1 patients, π1 = 1.0, the response probability for type 2, poor responders, π2 = 0. The response probabilities for both phenotypes to the control treatment, π3 and π4 both equal 0.2. The mean value of the z statistic for the alternative hypothesis is 2.96 (84% power for the trial). The proportion of patients, α, assigned to the experimental group is 0.5.
Figure 5
Figure 5
Cost estimates in a model study of heterogeneous responders. Cost constants in thousands of dollars are as follows: screening cost per case c1 = 1, treatment cost c2 = 10, opportunity cost c3 = 100/yr, case rate r = 50/yr, follow up time t =1 yr. Other details as in Figure 4.
Figure 6
Figure 6
Cost estimates in a scenario with good responsiveness to the control treatment in patients who are non-responsive to the experimental treatment. π1 = 1.0, π2 = 0, π3 = π4 = 0.4. Other details as in Figure 5. Dashed line divides the x-domain into regions of a significant negative effect (to the left) vs a significant positive effect (right). Near xc = 4.4 the cost of disproving the null hypothesis when it is exactly true becomes infinite.
Math 24
Math 24
Math(A1).
Math 25
Math 25
Math(A1).
Math 26
Math 26
Math(A1).
Math 27
Math 27
Math(A1).
Math 28
Math 28
Math(A1).
Math 29
Math 29
Math(A1).
Math 30
Math 30
Math(A1).
Math 31
Math 31
Math(A1).
Math 32
Math 32
Math(A1).
Math 33
Math 33
Math(A1).
Math 34
Math 34
Math(A1).
Math 35
Math 35
Math(A1).
Math 36
Math 36
Math(A1).
Math 37
Math 37
Math(A1).
Math 38
Math 38
Math(A1).
Figure 7
Figure 7
Fraction of patients. A: Separation of observed responders and non-responders to the experimental treatment along the x-domain in this reconstructed preliminary study. The fraction of patients with each x-value is show on the vertical axis. Patients with x-scores over 60% have a much greater likelihood of responding; B: ROC curve for the screening procedure.
Math 39
Math 39
Math(A1).
Math 40
Math 40
Math(A1).
Math 41
Math 41
Math(A1).
Figure 8
Figure 8
Regression analysis on the last two columns of Table 3. A plot of the hybrid variable, y = pC(u)(π + u), vs u can be used to evaluate model parameters π3 and π4. The slope of the regression line is π4, and the intercept divided by π is π3.
Figure 9
Figure 9
Cost estimates in a realistic test data set for targeted drug therapy of lung cancer, presented in Tables 2 and 3. Cost constants in thousands of dollars are as follows: screening cost per case c1 = 1, treatment cost c2 = 10, opportunity cost c3 = 100/year, case rate r = 50/year, follow up time t =1 year. Cost to the right of the dashed vertical asymptote are for a significant positive result (experimental treatment better than control). Costs to the left of the dashed vertical asymptote are for a significant negative result (experimental treatment worse than control).
Math 42
Math 42
Math(A1).
Math 43
Math 43
Math(A1).
Math 44
Math 44
Math(A1).
Math 45
Math 45
Math(A1).
Math 46
Math 46
Math(A1).
Math 47
Math 47
Math(A1).
Math 48
Math 48
Math(A1).
Math 49
Math 49
Math(A1).
Math 50
Math 50
Math(A1).
Math 51
Math 51
Math(A1).
Math 52
Math 52
Math(A1).
Math 53
Math 53
Math(A1).
Math 54
Math 54
Math(A1).
Math 55
Math 55
Math(A1).

Similar articles

Cited by

References

    1. Anderson JE, Hansen LL, Mooren FC, Post M, Hug H, Zuse A, Los M. Methods and biomarkers for the diagnosis and prognosis of cancer and other diseases: towards personalized medicine. Drug Resist Updat. 2006;9:198–210. - PubMed
    1. Ross JS, Slodkowska EA, Symmans WF, Pusztai L, Ravdin PM, Hortobagyi GN. The HER-2 receptor and breast cancer: ten years of targeted anti-HER-2 therapy and personalized medicine. Oncologist. 2009;14:320–368. - PubMed
    1. van’t Veer LJ, Bernards R. Enabling personalized cancer medicine through analysis of gene-expression patterns. Nature. 2008;452:564–570. - PubMed
    1. Yao Q, Wei LJ. Play the winner for phase II/III clinical trials. Stat Med. 1996;15:2413–223; discussion 2413-223;. - PubMed
    1. Bauer P, Köhne K. Evaluation of experiments with adaptive interim analyses. Biometrics. 1994;50:1029–1041. - PubMed