. 2015 May;9(5):1105-18.
doi: 10.1038/ismej.2014.202. Epub 2014 Oct 21.

Origin and ecological selection of core and food-specific bacterial communities associated with meat and seafood spoilage

Affiliations

Origin and ecological selection of core and food-specific bacterial communities associated with meat and seafood spoilage

Stéphane Chaillou et al. ISME J. 2015 May.

Abstract

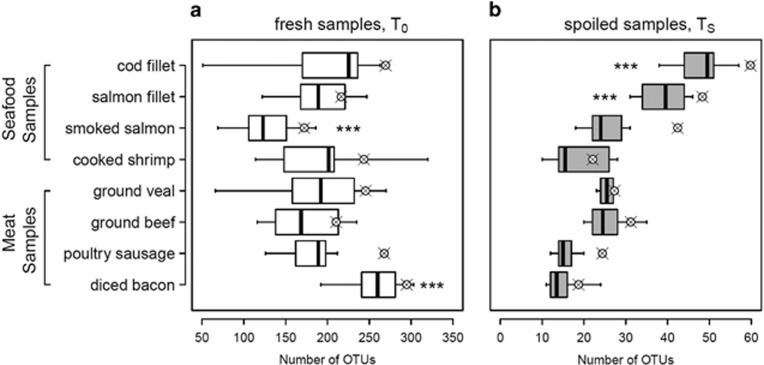
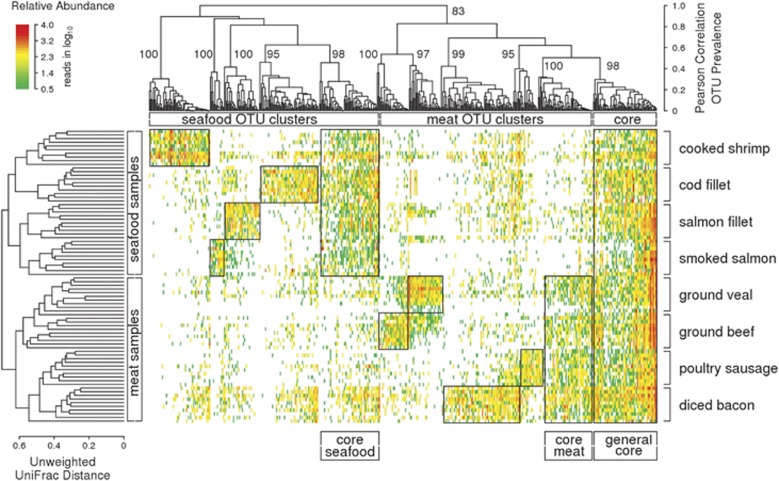
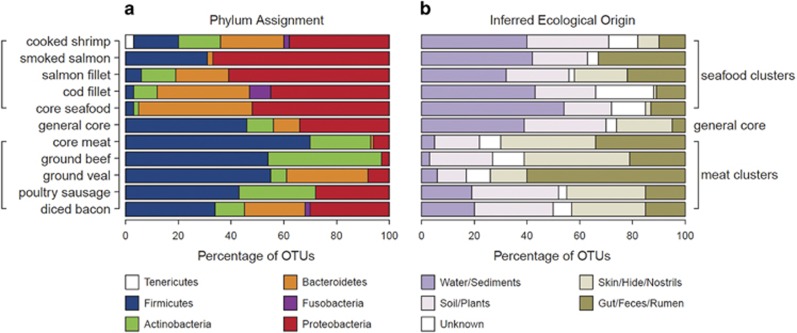
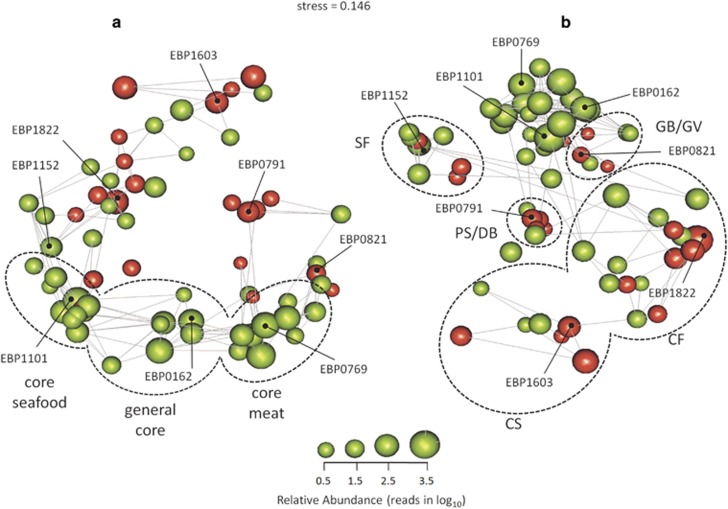
The microbial spoilage of meat and seafood products with short shelf lives is responsible for a significant amount of food waste. Food spoilage is a very heterogeneous process, involving the growth of various, poorly characterized bacterial communities. In this study, we conducted 16S ribosomal RNA gene pyrosequencing on 160 samples of fresh and spoiled foods to comparatively explore the bacterial communities associated with four meat products and four seafood products that are among the most consumed food items in Europe. We show that fresh products are contaminated in part by a microbiota similar to that found on the skin and in the gut of animals. However, this animal-derived microbiota was less prevalent and less abundant than a core microbiota, psychrotrophic in nature, mainly originated from the environment (water reservoirs). We clearly show that this core community found on meat and seafood products is the main reservoir of spoilage bacteria. We also show that storage conditions exert strong selective pressure on the initial microbiota: alpha diversity in fresh samples was 189±58 operational taxonomic units (OTUs) but dropped to 27±12 OTUs in spoiled samples. The OTU assemblage associated with spoilage was shaped by low storage temperatures, packaging and the nutritional value of the food matrix itself. These factors presumably act in tandem without any hierarchical pattern. Most notably, we were also able to identify putative new clades of dominant, previously undescribed bacteria occurring on spoiled seafood, a finding that emphasizes the importance of using culture-independent methods when studying food microbiota.


Figures

Figure 1
Figure 1
Bacterial richness in meat and seafood products. The box plot shows the number of OTUs identified in different food products at T0 (a) and TS (b). The boxes represent the interquartile range between the first and third quartiles and the vertical black line inside the box is the median obtained from the 10 samples analyzed per food product. The striped circles represent the average value of the Chao1 estimator (Chao, 1984) calculated from each set of 10 samples. The presence of stars indicates that samples deviated significantly from the average (P<0.01, two-tailed t-test).
Figure 2
Figure 2
Heat map showing the relationship between T0 sample UNIFRAC clustering and OTU prevalence. The tree on the left side of the figure depicts the unsupervised hierarchical clustering of the 80 T0 samples using the average linkage of unweighted UniFrac distances. The two main UniFrac clusters correspond to meat versus seafood products and the sub-branches are the 10 samples of each type of food product. The tree at the top of the figure depicts the unsupervised hierarchical clustering of the 508 OTUs in the T0 data set using the average linkage of the correlation distances calculated from the OTU prevalence values. The approximately unbiased P-values were calculated using multiscale bootstrap resampling in PVCLUST and are given for each OTU prevalence cluster (boxes on the heat map). The identities of these OTU clusters are provided at the bottom of the tree; the identities of the core community clusters are identified at the bottom of the figure. A complete list of the OTUs, organized according to prevalence clusters and taxonomic assignment, can also be found in Supplementary File S4.
Figure 3
Figure 3
Inferred taxonomy and ecological origin of T0 OTU prevalence clusters. Barplots showing (a) the phylum-level distribution of the OTUs within each prevalence cluster observed at T0 and (b) the distribution of the inferred ecological origins of the OTUs. Ecological origins were inferred for each OTU attributed to a known species and for which a reference was available. Details about this process can be found in the Methods section and in Supplementary File S4. The white bar in b indicates OTUs without assignments at the 97% identity threshold in cultured (LTPs106) and uncultured (EZtaxon-e) databases.
Figure 4
Figure 4
Co-occurrence network of OTUs in spoiled (Ts) meat and seafood samples. a and b show two angle views of the tri-dimensional network ordination space obtained by applying non-metric multi-dimentional scaling (SAMMON) to a co-occurrence distance matrix that included the most important OTUs identified at TS. Each sphere represents one OTU, and sphere size is proportional to that OTU's average relative abundance among the 80 TS samples. Green spheres depict OTUs persisting from T0 core communities, and red spheres depict OTUs persisting from T0 product-specific communities. When OTUs had a co-occurrence level above the median value of 46.5%, this is depicted with a thin gray line. OTUs demonstrating strong co-occurrence (>70%) are usually packed together to form modular structures. Dotted ellipses depict clusters of co-occurring OTUs with their cognate labeling written aside. The sample codes are those used in Table 1. a uses a view in which the three core communities are stretched apart, and the strong interconnectivity between the general core community and both the core seafood and core meat communities can be seen. b uses a view that focuses on the product-specific OTUs and their connectivity to their respective core communities (meat or seafood). A few OTUs were depicted to serve as visual references between the two views; their OTU number is indicated in black next to a line marking the relevant sphere. B. thermosphacta (EBP0162) was used as the reference for the general core module; Photobacterium phosphoreum (EBP1101) was the reference for the core seafood module; Lactobacillus sakei (EPB0769) was the reference for the core meat module; Propionibacterium acnes (EBP1152) was the reference for the salmon-specific module; Streptococcus parauberis (EBP1603) was the reference for the shrimp-specific module; Uncultured fusobacteriaceae (EBP1822) was the reference for the cod-specific module; Leuconostoc gelidum (EBP0821) was the reference for the beef- and veal-specific module; and Lactobacillus malefermentans (EBP0791) was the reference for the diced bacon and poultry sausages module.
Figure 5
Figure 5
Comparative analysis of the changes that occurred in bacterial communities between T0 and TS. In this analysis, the abundance of each of the 113 OTUs in the TS data set was extracted from the T0 data set; their relative abundances at T0 and TS were then compared to illustrate converging or diverging trajectories of abundance among spoiled samples of the same food type. The plots show the results of the principal coordinates analysis (PCoA) that used pairwise weighted UNIFRAC distances for each food type at T0 (white symbols) and TS (gray symbols). Samples that came from the same batch of food are connected with a thin striped line. Food types were analyzed in three separate plots and independent UNIFRAC analysis (ac) for clarity. (a) Meat samples. Diced bacon and poultry sausages samples (squares); ground beef and ground veal samples (circles). (b) Salmon samples. Salmon fillet samples (squares); smoked salmon samples (circles). (c) Cod and shrimp samples. Cod fillet samples (squares); cooked shrimp samples (circles). The proportion of variance explained by each axis is shown.

Similar articles

Cited by

References

    1. Argyri AA, Doulgeraki AI, Blana VA, Panagou E, Nychas GJE. Potential of simple HPLC-based approach for the identification of the spoilage status of minced beef stored at various temperature and packaging systems. Int J Food Microbiol. 2001;150:25–33. - PubMed
    1. Baele M, Vancanneyt M, Devriese LA, Lefebvre K, Swings J, Haesebrouck F. Lactobacillus ingluviei sp. nov., isolated from the intestinal tract of pigeons. Int J Syst Evol Microbiol. 2003;53:133–136. - PubMed
    1. Banat IM, Marchant R, Rahman TJ. Geobacillus debilis sp. nov., a novel obligately thermophilic bacterium isolated from a cool soil environment, and reassignment of Bacillus pallidus to Geobacillus pallidus comb. nov. Int J Syst Evol Microbiol. 2004;54:2197–2201. - PubMed
    1. Barott KL, Rodriguez-Brito B, Janouskovec J, Marhaver KL, Smith JE, Keeling P, et al. Microbial diversity associated with four functional groups of benthic reef algae and the reef-building coral Montastraea annularis. Environ Microbiol. 2011;13:1192–1204. - PubMed
    1. Borch E, Kant-Muermans ML, Blixt Y. Bacterial spoilage of meat and cured meat products. Int J Food Microbiol. 1996;33:103–120. - PubMed

Publication types

Substances