. 2014 Oct 21;9(10):e109747.
doi: 10.1371/journal.pone.0109747. eCollection 2014.

Lifespan based pharmacokinetic-pharmacodynamic model of tumor growth inhibition by anticancer therapeutics

Affiliations

Lifespan based pharmacokinetic-pharmacodynamic model of tumor growth inhibition by anticancer therapeutics

Gary Mo et al. PLoS One. .

Abstract

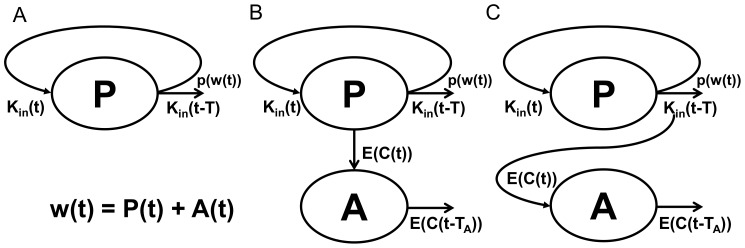
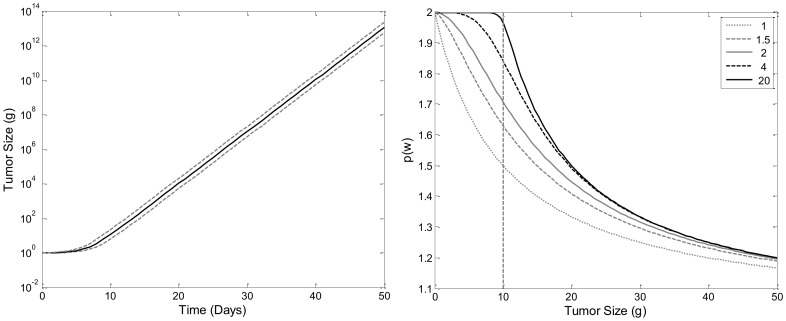
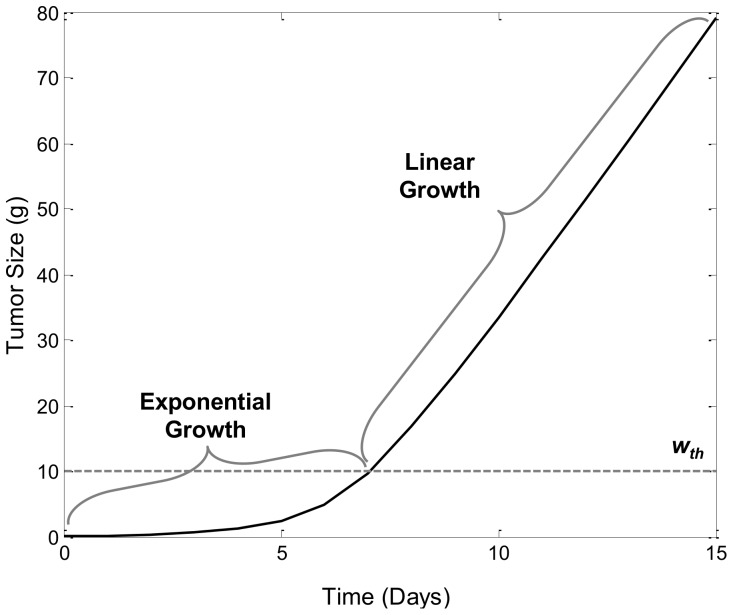
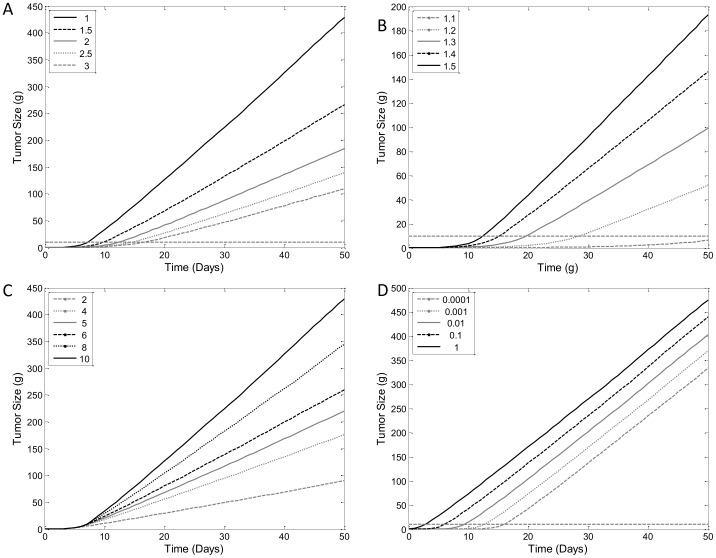
Accurate prediction of tumor growth is critical in modeling the effects of anti-tumor agents. Popular models of tumor growth inhibition (TGI) generally offer empirical description of tumor growth. We propose a lifespan-based tumor growth inhibition (LS TGI) model that describes tumor growth in a xenograft mouse model, on the basis of cellular lifespan T. At the end of the lifespan, cells divide, and to account for tumor burden on growth, we introduce a cell division efficiency function that is negatively affected by tumor size. The LS TGI model capability to describe dynamic growth characteristics is similar to many empirical TGI models. Our model describes anti-cancer drug effect as a dose-dependent shift of proliferating tumor cells into a non-proliferating population that die after an altered lifespan TA. Sensitivity analysis indicated that all model parameters are identifiable. The model was validated through case studies of xenograft mouse tumor growth. Data from paclitaxel mediated tumor inhibition was well described by the LS TGI model, and model parameters were estimated with high precision. A study involving a protein casein kinase 2 inhibitor, AZ968, contained tumor growth data that only exhibited linear growth kinetics. The LS TGI model accurately described the linear growth data and estimated the potency of AZ968 that was very similar to the estimate from an established TGI model. In the case study of AZD1208, a pan-Pim inhibitor, the doubling time was not estimable from the control data. By fixing the parameter to the reported in vitro value of the tumor cell doubling time, the model was still able to fit the data well and estimated the remaining parameters with high precision. We have developed a mechanistic model that describes tumor growth based on cell division and has the flexibility to describe tumor data with diverse growth kinetics.


Conflict of interest statement

Competing Interests: FG is currently affiliated with AstraZeneca. This does not alter the authors' adherence to PLOS ONE policies on sharing data and materials.

Figures

Figure 1
Figure 1. Model Schematics.
A) Unperturbed tumor growth, B) Non-cycle-specific perturbed tumor growth, and C) Cycle-specific perturbed tumor growth. The meanings of the symbols and variables are explained in the model development section.
Figure 2
Figure 2. Simulated Effect of Division Efficiency on Tumor Growth.
A) Semi-log plot of tumor growth with constant division efficiency of p0 = 2. Upper and lower dashed lines indicate upper and lower bound described by eq. 12. B) Simulation of cell division efficiency function, p(w), vs tumor weight, w, for different values of ψ. The threshold, wth, was set to 10 g, and initial efficiency, p0 is set to 2.
Figure 3
Figure 3. Simulation Tumor Growth Profile of TGI Lifespan Model.
Plot of tumor weight vs. time. The threshold, wth, which is set to 10 g, is indicated by the dashed line. Doubling time of the tumor cells, T, was set to 1 day, kin0 was set to 0.05 g/day and p0 is set to 2.
Figure 4
Figure 4. Sensitivity Analysis of Unperturbed Tumor Growth.
Simulated model profiles of varying values of A) Tumor cell lifespan (T), B) Initial division efficiency (p0), C) Tumor size threshold (wth) for decrease in division efficiency, and D) Past tumor growth rate (kin0). Simulation were carried with parameters values of T = 1 day, p0 = 2, kin0 = 0.05 g/day and wth = 10 g, unless otherwise specified for each figure. Dashed lines in panels A–C indicate the wth value.
Figure 5
Figure 5. Sensitivity Analysis of Non-Cycle-Specific Drug Effect Model.
Simulated model profiles with changes in A) Apoptosis duration, TA, and B) Linear drug potency constant, k2. C) Signature profile of cycle-specific drug mechanism model with dose escalation. Simulation were carried with parameters values of T = 1 day, TA = 4 days, p0 = 2, kin0 = 0.05, wth = 10 g, and k2 = 1.5 mL/ng, unless otherwise indicated. Arrows indicate dose administration on days 10, 20 and 30.
Figure 6
Figure 6. Sensitivity Analysis of Cycle-Specific Drug Effect Model.
Simulated model profiles with changes in: A) Apoptosis duration, TA, B) Maximum drug efficacy, Emax, and C) Drug potency, EC50. D) Signature profile of cycle-specific drug mechanism model with dose escalation. Simulation were carried with parameters values of T = 1 day, TA = 4 days, p0 = 2, kin0 = 0.05 g/day, wth = 10 g, Emax = 1 and EC50 = 0.01 concentration, unless otherwise indicated. Arrows indicate dose administration at days 10, 20 and 30.
Figure 7
Figure 7. Modeling Tumor Growth Inhibition by Paclitaxel.
A) Observed (black squares) and model fitted (black line) tumor weight during untreated tumor growth. Data was digitized from (Simeoni et al, 2004). Initial tumor volume was fixed at 0.033 g as estimated from original publication. B) Simultaneous fitting of unperturbed tumor growth data (black square) with model preduction (black line) and tumor growth inhibition data (grey triangle) and model prediction using the cycle-specific drug effect model (grey line) by 30 mg/kg of paclitaxel administered every 4 days for 3 rounds starting from day 8.
Figure 8
Figure 8. Model Comparison: Modeling Tumor Growth Inhibition by AZ968.
A) Modeling of pharmacokinetic data after single i.p. dose of AZ968 at 10, 20 and 30 mg/kg. Data (symbols) was described with a 2 compartment model with dose-dependent elimination rate constant and central volume of distribution (model prediction in lines). B) Observed (symbols) and model predicted (lines) tumor volume using the lifespan model of tumor growth inhibition. Line style and color indicate unrestricted condition and oral treatment with AZ968 at 10, 20 and 30 mg/kg in mice xenograft. Symbols indicate control condition (black squares), 10 mg/kg AZ968 (black circles), 20 mg/kg (grey diamonds), and 30 mg/kg (grey triangles). Initial tumor volume was fixed at 180 mm3 as estimated from initial data points. C) Fitting of same AZ968 data using the Simeoni model.
Figure 9
Figure 9. Tumor Growth Inhibition by AZD1208.
A) Pharmacokinetic profile of AZD1208 was described using a 1 compartment model with equal values for absorption and elimination rate constants. PK data (symbols) were collected following a single oral administration of AZD1208 at 3, 10 and 30 mg/kg (model prediction in lines). B) Observed (symbol) and lifespan model predicted (lines) tumor growth and inhibition by AZD1208 at 0.3, 1, 3, 10 and 30 mg/kg given orally. Initial tumor volume was fixed to 170 mm3, which is the value of the first tumor size measurement.

Similar articles

Cited by

References

    1. Danhof M, de Lange ECM, Della Pasqua OE, Ploeger BA, Voskuyl RA (2008) Mechanism-based pharmacokinetic-pharmacodynamic (PK-PD) modeling in translational drug research. Trends in Pharmacological Sciences 29: 186–191. - PubMed
    1. Schabel FM (1969) The Use of Tumor Growth Kinetics in Planning “Curative” Chemotherapy of Advanced Solid Tumors. Cancer Res 29: 2384–2389. - PubMed
    1. Bajzer Z, Marušić M, Vuk-Pavlović S (1996) Conceptual frameworks for mathematical modeling of tumor growth dynamics. Mathematical and Computer Modelling 23: 31–46.
    1. Sachs RK, Hlatky LR, Hahnfeldt P (2001) Simple ODE models of tumor growth and anti-angiogenic or radiation treatment. Mathematical and Computer Modelling 33: 1297–1305.
    1. Frei E 3rd, Bickers JN, Hewlett JS, Lane M, Leary WV, et al. (1969) Dose schedule and antitumor studies of arabinosyl cytosine (NSC 63878). Cancer Res 29: 1325–1332. - PubMed

Publication types

MeSH terms

LinkOut - more resources