. 2014 Oct 21;12(10):e1001972.
doi: 10.1371/journal.pbio.1001972. eCollection 2014 Oct.

A synaptic mechanism for temporal filtering of visual signals

Affiliations

A synaptic mechanism for temporal filtering of visual signals

Tom Baden et al. PLoS Biol. .

Abstract

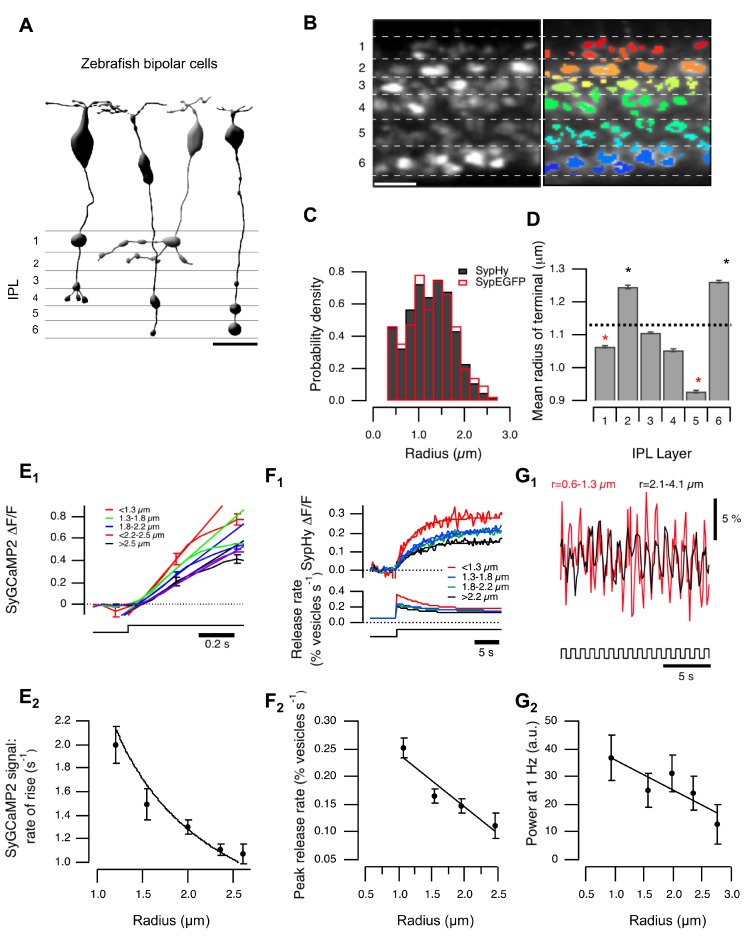
The visual system transmits information about fast and slow changes in light intensity through separate neural pathways. We used in vivo imaging to investigate how bipolar cells transmit these signals to the inner retina. We found that the volume of the synaptic terminal is an intrinsic property that contributes to different temporal filters. Individual cells transmit through multiple terminals varying in size, but smaller terminals generate faster and larger calcium transients to trigger vesicle release with higher initial gain, followed by more profound adaptation. Smaller terminals transmitted higher stimulus frequencies more effectively. Modeling global calcium dynamics triggering vesicle release indicated that variations in the volume of presynaptic compartments contribute directly to all these differences in response dynamics. These results indicate how one neuron can transmit different temporal components in the visual signal through synaptic terminals of varying geometries with different adaptational properties.


Conflict of interest statement

The authors have declared that no competing interests exist.

Figures

Figure 1
Figure 1. Variations in terminal size, calcium signals, and vesicle release.
(A) BCs transmit through multiple terminals. Left: published examples of zebrafish cone BCs illustrate the range of presynaptic terminal sizes. Scalebar = 10 µm. (B) BC terminals in the IPL of a zebrafish (10 dpf) expressing sypHy under control of the ribeye promoter. Left: Raw image showing six strata of the IPL. Right: Overlay of ROIs defining terminals. Scale bar = 10 µm. (C) The distribution of the effective terminal radii. Black bars show estimates obtained in fish expressing sypHy (n = 5,061 terminals from seven fish), and the red bars shows the distribution measured in fish expressing synaptophysin-EGFP (n = 421 terminals from one fish). Distribution of sizes calculated with SyGCaMP2 is shown in Figure S1H. (D) Variations in average radius of terminals in each stratum. The average radius over the whole IPL was 1.13±0.40 µm (dashed line). Stars mark strata in which the average radius was significantly greater or smaller (p<0.001, Wilcoxon rank-sum test, n varies between 560 and 930 terminals). Similar distributions calculated for individual layers are shown in Figure S1I. (E) Relation between terminal size and calcium signals. (E1) SyGCaMP2 signals in response to a step of light (λ = 590 nm; for details see methods) in ON terminals, averaged over groups of the effective radius shown (n = 143, 347, 286, 114, and 36, respectively). Straight lines fitted over the initial phase. Significant difference between groups 1, 3, and 5 (Student's t test: p (1–3) = 0.004; p (3–5) = 0.005; p (1–5)<0.001). (E2) The rate of rise of the SyGCaMP2 signal varies as the inverse of the radius, as shown by the fitted curve (n = 926 from five fish). Spearman correlation coefficient = −1, critical value (p = 0.05) = 0.85. (F) Relation between terminal size and peak rate of vesicle release. (F1) SypHy signals in response to a step of light in ON terminals, averaged over groups of the effective radius shown (n = 117, 176, 113, and 33 terminals from five fish). The lower panel shows the conversion into relative release rates, as described . (F2) The initial rate of vesicle release as a function of radius (total n = 438 terminals from five fish). The points fall on a line. Spearman correlation = −1, critical value (p = 0.05) = 0.9. (G) terminal size and modulation of presynaptic calcium. (G1) SyGCaMP2 signal driven by modulation of light intensity at 1 Hz (100% contrast, square wave). Red trace averaged over OFF contrast responding terminals with r = 0.6–1.3 µm; black trace averaged over OFF contrast responding terminals with r = 2.1–4.1 µm. (G2) relative power of the signal at 1 Hz as a function of radius (n = 98, 89, 68, 37, and 9 terminals from four fish). Points were fitted with a line. Responses to light decrements are shown in Figure S1G.
Figure 2
Figure 2. The relation between terminal volume and release rate persists when GABAergic feedback inhibition is blocked.
The initial rate of release in response to a step of light in control terminals (black, from Figure 1F2 ) is compared with measurements in which 100 M picrotoxin was injected in the front of the eye (77 ON terminals from three fish). The line fitted to the control has a slope of −0.096±0.023, and the line fitted to the picrotoxin measurements has a slope of −0.138±0.01 dependence peak release size (Figure 1F2 ). Note that picrotoxin also increased the amplitude of the exocytic response, as would be expected when feedback inhibition is reduced.
Figure 3
Figure 3. Different calcium signals in small and large terminals of the same cell.
(A) A BC expressing GCaMP5. Large and small terminals are indicated by the blue and red arrows. Scalebar 10 µm. (B) Responses of the terminals in (A) to a stimulus modulated at 1 Hz. (C) Power spectrum of the responses from large and small terminals calculated for different stimulus frequencies. (D) Mixed BC filled with OGB-5N in a slice of goldfish retina. Scale bar 10 µm. (E) Spatially averaged Ca2+ signals in the small (red) and large (black) terminal during a 2 s depolarizing current step (10 pA). This BC did not generate spikes. (F) A comparison of Ca2+ signals in the small and large terminal of a “spiking” BC. Each spike caused a calcium transient that was larger and faster in the smaller terminal. (G–I) Time constants of the calcium signal rise (trise), decay (tdecay), and peak amplitude, evaluated in 16 pairs of small and large terminals. For small and large, τrise = 0.25±0.20 and 1.16±0.64 s; τdecay = 1.42±0.82 and 2.91±2.05 s; amplitude = 1.29±0.38 and 0.68±0.21 µM. All these parameters were significantly different in small and large terminals (p<0.001; Wilcoxon ranked sum, n = 16 cells from nine adult retinae). The average radii of the small and large terminals were 1.1±0.3 and 5.2±1.2 µm, respectively. (J) Time constants of calcium decay were directly proportional to terminal radius determined using imaging (grey, n = 32 terminals) or capacitance measurements (black, n = 20 terminals). The linear fit was constrained to go through the origin. Error bars show 1 standard deviation (SD).
Figure 4
Figure 4. A simple model to predict global calcium changes in the presynaptic terminal.
(A) The stimulus (here a 1 Hz square wave) was convolved with the photoreceptor impulse response to estimate membrane voltage (top). Subsequently, the current through L-type calcium channels was calculated based on the I–V relation and number of channels (middle). Convolution of the calcium current with the synaptic calcium impulse response, calculated from Figure 3G, yielded an estimate of global calcium concentration over time (bottom). (B, C) Measured (B), and modeled (C), global calcium changes in a small (red; radius = 1 µm) and large (black; radius = 3 µm) terminals responding to a 1 Hz square wave stimulus. Data in (B) from goldfish “mixed” BC (cf. Figure 3D–3J).
Figure 5
Figure 5. A model of vesicle release through the ribbon.
(A) Schematic showing three vesicle pools involved in the exocytic response triggered by calcium. (B) The model (black) closely reproduces the three phases of release measured by (grey) upon maximal activation of calcium channels. (C1) Bulk calcium and (D1) vesicle release modeled for OFF terminals with different radii (1.2, 1.6, 2.8 µm) when a light step is turned off. (C2) The initial rate of rise of the calcium signal (calcium gain) varies as 1/r, while release gain falls linearly with r (D2). (E1) Calcium in response to a 1 Hz square wave stimulus in different size terminals. (E2) Power at the stimulus frequency falls with 1/r (cf. Figure 1E2 ). See also Figure S4. (E2) Inset: unlike the one-compartment model, the 3-D diffusion model (Figure S3) predicts a linear relation between power at the stimulus frequency and radius.
Figure 6
Figure 6. Contrast adaptation depends on terminal size: comparison of model and experiment.
(A) Top, vesicle release modeled in small (red) and large (black) terminals in response to a 5 Hz stimulus (100% contrast). Small terminals are predicted to exhibit stronger adaptation. Bottom, dynamics of three vesicle pools used in the model. RRP and IP deplete faster in small terminals while RP in small and large terminals remains near constant. (B) Modeled adaptation index (Methods) decreases linearly with terminal radius. (C) Adaptation of synaptic output measured in vivo was more profound in smaller terminals. Graph shows release dynamics of OFF terminals with r<1 µm (red) and r>1.2 µm (black) in response to a 5 Hz stimulus (cf. (A)). (D) Adaptation index decreases linearly with terminal radius, as predicted by the model (n = 236 OFF terminals from seven fish, each bin is an average of 12 individual terminals). Spearman correlation = −0.86, critical value (p = 0.05) = 0.45. See also Figure S5.
Figure 7
Figure 7. Linear and rectifying components of contrast response vary with terminal size.
(A) SyGCaMP2 responses of BC terminals to stimuli of varying contrast (3 Hz). Average ΔF/F of all contrast responding terminals (both ON and OFF) with r<1.5 µm (n = 66 terminals, red) and r>2.5 µm (n = 119 terminals, black). Note how these synaptic calcium responses are strongly rectifying. (B) Power of the DC component measured at 0.01 Hz for stimuli shown in (A). The DC component was larger in small terminals (cf. Figure 4C). (C) Power spectrum of the response to 100% contrast (3 Hz) for small (red) and large (black) terminals. (D) Power at 3 Hz varies with contrast. See also Figure S4. (E) Power of the linear and DC components are directly proportional, but the proportionality coefficient is larger for smaller terminals. The Pearson correlation coefficient was 0.99 for small terminals and 0.97 for large. (F) Modeled release in response to a 3 Hz stimulus (100% contrast). (G) The model predicts that the power of the calcium response at 3 Hz is directly proportional to the power of the DC component, as was observed experimentally in (E). (H) Power of the exocytic response modeled for a range of stimulus frequencies. Power at the stimulus frequency varies as 1/f for both small and large terminals.
Figure 8
Figure 8. Frequency tuning of BCs with different terminal size.
(A) Mean sypHy fluorescence signals in OFF terminals in response to full-field stimuli of different temporal frequencies measured in vivo (red, rsmall<1 µm, n = 10; black, rlarge>1.5 µm, n = 32). (B) Synaptic gain of large (black) and small (red) terminals as a function of stimulus frequency. Results are described by the functionformula image
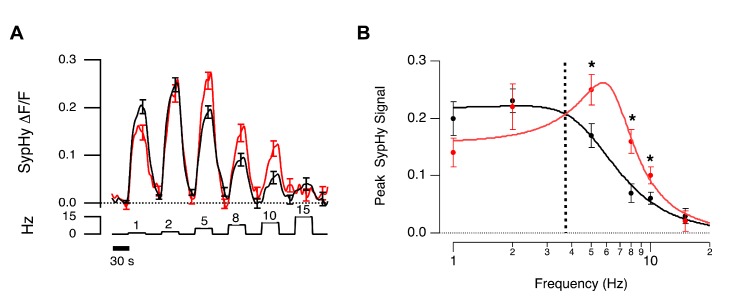
For large terminals, A = 0.22±0.02, fo = 4.96±0.45, Q = 0.78±0.17. For small terminals A = 0.16±0.02, fo = 6.43±0.27, Q = 1.57±0.37. Asterisks mark significantly different responses at a given frequency, as evaluated by Mann-Whitney U test (p<0.05).

References

    1. Masland RH (2001) The fundamental plan of the retina. Nat Neurosci 4: 877–886. - PubMed
    1. Roska B, Werblin F (2001) Vertical interactions across ten parallel, stacked representations in the mammalian retina. Nature 410: 583–587. - PubMed
    1. Wässle H (2004) Parallel processing in the mammalian retina. Nat Rev Neurosci 5: 747–757. - PubMed
    1. Masland RH (2012) The neuronal organization of the retina. Neuron 76: 266–280. - PMC - PubMed
    1. Euler T, Haverkamp S, Schubert T, Baden T (2014) Retinal bipolar cells: elementary building blocks of vision. Nat Rev Neurosci 15: 507–519. - PubMed

Publication types

LinkOut - more resources