. 2014 Dec 1;190(11):1263-72.
doi: 10.1164/rccm.201408-1452OC.

Relationship of DNA methylation and gene expression in idiopathic pulmonary fibrosis

Affiliations

Relationship of DNA methylation and gene expression in idiopathic pulmonary fibrosis

Ivana V Yang et al. Am J Respir Crit Care Med. .

Abstract

Rationale: Idiopathic pulmonary fibrosis (IPF) is an untreatable and often fatal lung disease that is increasing in prevalence and is caused by complex interactions between genetic and environmental factors. Epigenetic mechanisms control gene expression and are likely to regulate the IPF transcriptome.

Objectives: To identify methylation marks that modify gene expression in IPF lung.

Methods: We assessed DNA methylation (comprehensive high-throughput arrays for relative methylation arrays [CHARM]) and gene expression (Agilent gene expression arrays) in 94 patients with IPF and 67 control subjects, and performed integrative genomic analyses to define methylation-gene expression relationships in IPF lung. We validated methylation changes by a targeted analysis (Epityper), and performed functional validation of one of the genes identified by our analysis.

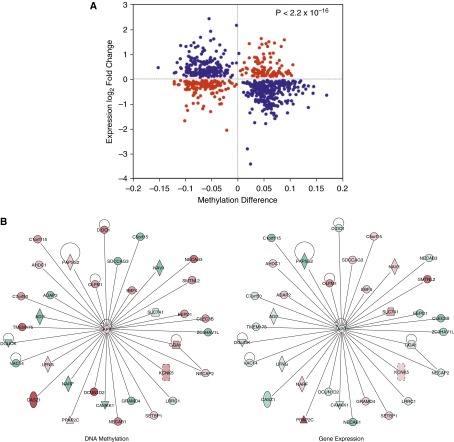
Measurements and main results: We identified 2,130 differentially methylated regions (DMRs; <5% false discovery rate), of which 738 are associated with significant changes in gene expression and enriched for expected inverse relationship between methylation and expression (P < 2.2 × 10(-16)). We validated 13/15 DMRs by targeted analysis of methylation. Methylation-expression quantitative trait loci (methyl-eQTL) identified methylation marks that control cis and trans gene expression, with an enrichment for cis relationships (P < 2.2 × 10(-16)). We found five trans methyl-eQTLs where a methylation change at a single DMR is associated with transcriptional changes in a substantial number of genes; four of these DMRs are near transcription factors (castor zinc finger 1 [CASZ1], FOXC1, MXD4, and ZDHHC4). We studied the in vitro effects of change in CASZ1 expression and validated its role in regulation of target genes in the methyl-eQTL.

Conclusions: These results suggest that DNA methylation may be involved in the pathogenesis of IPF.

Keywords: DNA methylation; gene expression; mapping; pulmonary fibrosis; quantitative trait.


Figures

Figure 1.
Figure 1.
Differentially methylated regions (DMRs) are associated with idiopathic pulmonary fibrosis (IPF) after controlling for age, sex, pack-years of smoking, technical variables, and batch effects. (A) Manhattan plot of the adjusted P values for disease status (IPF/control) from the linear model. DMRs are identified as significant (α < 5% after correcting for the number of possible DMRs) using the linear model: % methylation ∼ disease + sex + age + pack-years + technician + signal_strength + [five probabilistic estimation of expression residual factors]. Each dot represents a P value for a probe on the comprehensive high-throughput arrays for relative methylation (CHARM) array that has been adjusted by the significance of neighboring probes within 300 bases according to their correlation. Highlighted in red are probes within 127 significant DMRs with most pronounced methylation changes (absolute change ≥ 10%) between cases and control subjects. Heatmap of all 2,130 DMRs is shown in Figure E1. Genomic distribution of 2,130 DMRs by relationship to (B) gene and (C) CpG island. (D) Internal validation of 15 selected DMRs (two PCR products are included for the DMR in SOX7) on the Epityper platform. Plotted on the y axis are percent methylation values versus CpG site on the x axis. Red dots represent IPF samples; blue dots are controls.
Figure 2.
Figure 2.
Expression changes in genes within 5 kilobases of the nearest differentially methylated region (DMR) associated with idiopathic pulmonary fibrosis (IPF). (A) Plotted are expression data for 738 genes that have a DMR within 5 kilobases of the gene (defined from the transcription start site to the last base of the last exon). The x-axis methylation difference is represented by the mean percent methylation difference in IPF compared with control; y axis expression difference is represented by the mean fold change in IPF compared with control (on the log base 2 scale). The blue dots represent hypomethylated genes that were associated with increased gene expression and hypermethylated genes were associated with decreased gene expression. The red dots represent methylation changes that were not associated with expected gene expression differences. The P value is the binomial P value for enrichment of expected methylation–gene expression relationships (blue dots) in the dataset. (B) The most significant protein–protein network (score = 54) identified by Ingenuity Pathway Analysis (IPA) demonstrates that a number of genes with differential methylation and expression in IPF lung are known to have direct interactions (solid lines) with the amyloid β precursor using data in the Ingenuity Knowledge Base. Green indicates lower methylation or expression in IPF; red indicates higher methylation or expression in IPF compared with control lung. Methylation values are colored based on percent methylation change between IPF and controls; colors of expression values are based on log2(fold change) between IPF and controls. Molecule shapes: oval = transcriptional regulator; diamond = enzyme; dashed line rectangle = channel; up triangle = phosphatase; down triangle = kinase; trapezoid = transporter; circle = other. This analysis was restricted to only direct relationships. The network score is based on the hypergeometric distribution, and is calculated with the right-tailed Fisher’s exact test to identify enrichment of differentially methylated/expressed genes in the network relative to IPA database. The other nine networks with scores of greater than 30 are shown in Figure E2.
Figure 3.
Figure 3.
Methylation–expression quantitative trait loci (methyl-eQTL) mapping evaluates the association between epigenetic loci (x axis) and individual differences in quantitative levels of expressed genes (y axis) in idiopathic pulmonary fibrosis (IPF) cases (n = 94) versus control subjects (n = 67). Statistically significant expression changes that are associated with methylation differences in IPF compared with controls. Analysis was performed on 1,315 differentially expressed genes in IPF compared with controls (5% false discovery rate [FDR] and more than twofold change) and 50% of CHARM probes with most variable probes across the entire dataset. The model used was expression ∼ methylation + disease + sex + age + pack-years. On this plot of significant expression changes (y axis) that are associated with methylation differences (x axis), each dot represents a significant difference in expression being affected by methylation (<0.1% FDR) after adjusting for disease, sex, age, and pack-years of smoking. Methylation changes that control expression of genes within 1 megabase (Mb) of the gene are referred to as cis-QTLs, whereas methylation changes that regulate expression of more distant (>1 Mb) genes are trans-QTLs. Blue dots represent inverse relationships of methylation and expression (negative T sum) and red dots are positive relationships of methylation and expression (positive T sum). The size of the dot is proportional to the P value of the significance of the methylation–expression relationship. Vertical lines of expression changes indicate methylation marks that regulate large groups of genes (master regulators of expression). The five most significant trans lines are annotated with the name of the gene nearest the differentially methylated region (DMR). Modules of genes the expression of which is regulated by methylation marks in the five trans methyl-eQTLs highlighted in (A) are shown in Figure E3.
Figure 4.
Figure 4.
Localization of castor zinc finger (CASZ) 1 expression in idiopathic pulmonary fibrosis (IPF) lung. Immunohistochemical staining of normal (AC) and IPF (DF) lung tissue reveals a decrease in expression of CASZ1 in airway epithelial cells in IPF compared with control lung accompanied by an increase in expression in alveolar type II cells in alveolar cysts in IPF lung. Tissue sections were counterstained with hematoxylin. Images were taken at 10× magnification (40× for insets).

Comment in

References

    1. King TE, Jr, Pardo A, Selman M. Idiopathic pulmonary fibrosis. Lancet. 2011;378:1949–1961. - PubMed
    1. Yang IV, Coldren CD, Leach SM, Seibold MA, Murphy E, Lin J, Rosen R, Neidermyer AJ, McKean DF, Groshong SD, et al. Expression of cilium-associated genes defines novel molecular subtypes of idiopathic pulmonary fibrosis. Thorax. 2013;68:1114–1121. - PMC - PubMed
    1. Zuo F, Kaminski N, Eugui E, Allard J, Yakhini Z, Ben-Dor A, Lollini L, Morris D, Kim Y, DeLustro B, et al. Gene expression analysis reveals matrilysin as a key regulator of pulmonary fibrosis in mice and humans. Proc Natl Acad Sci USA. 2002;99:6292–6297. - PMC - PubMed
    1. Kass DJ, Kaminski N. Evolving genomic approaches to idiopathic pulmonary fibrosis: moving beyond genes. Clin Transl Sci. 2011;4:372–379. - PMC - PubMed
    1. Baumgartner KB, Samet JM, Stidley CA, Colby TV, Waldron JA. Cigarette smoking: a risk factor for idiopathic pulmonary fibrosis. Am J Respir Crit Care Med. 1997;155:242–248. - PubMed

Publication types