. 2014 Oct 21;9(10):e109162.
doi: 10.1371/journal.pone.0109162. eCollection 2014.

Near-infrared imaging of adoptive immune cell therapy in breast cancer model using cell membrane labeling

Affiliations

Near-infrared imaging of adoptive immune cell therapy in breast cancer model using cell membrane labeling

Fatma M Youniss et al. PLoS One. .

Abstract

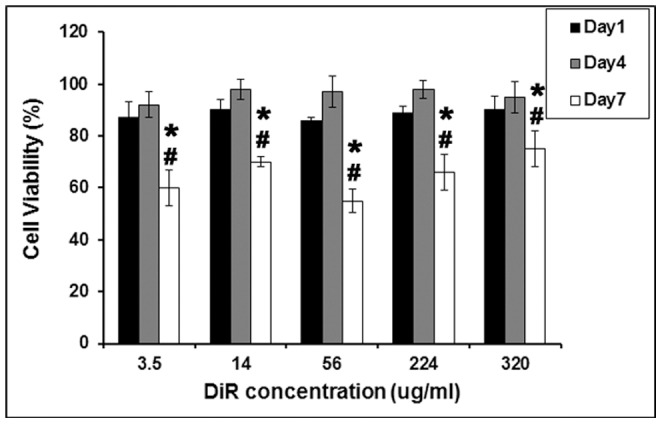
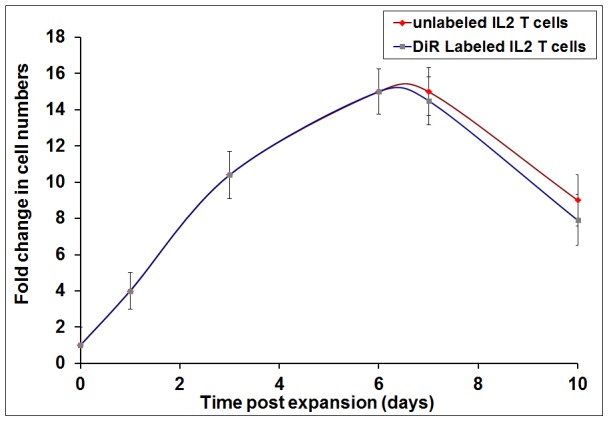
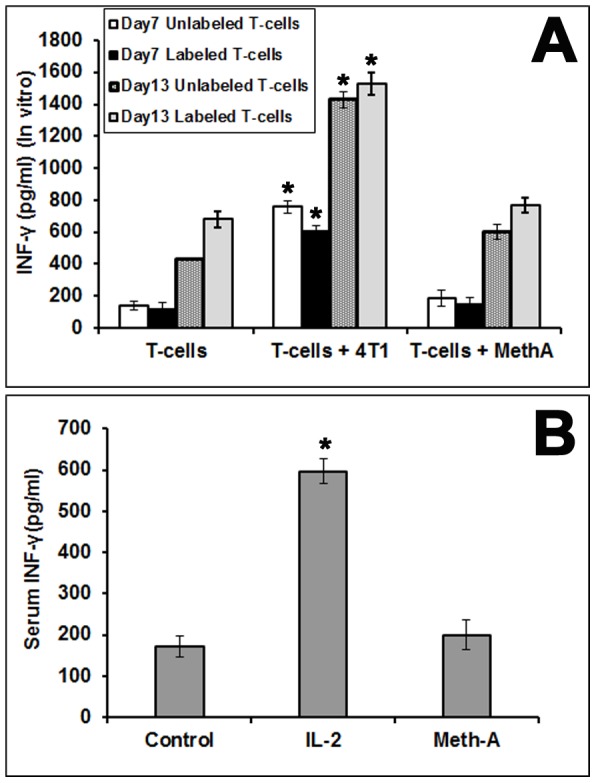
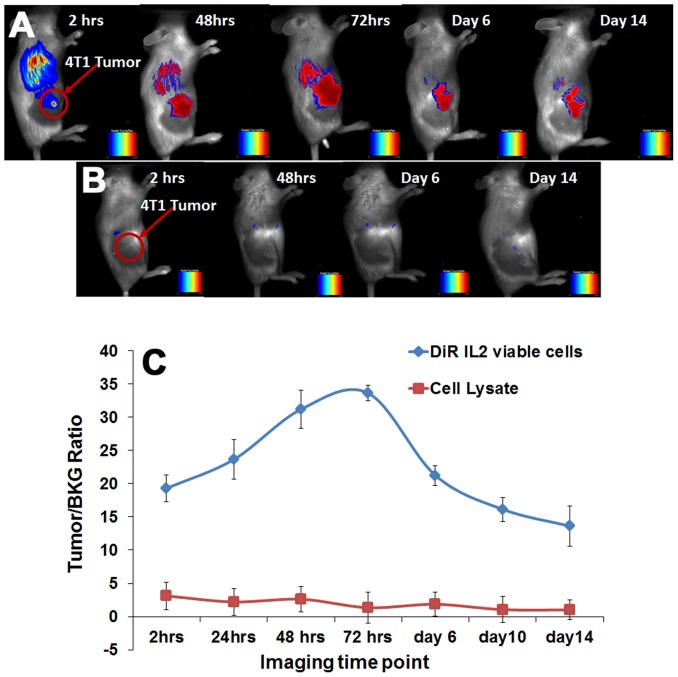
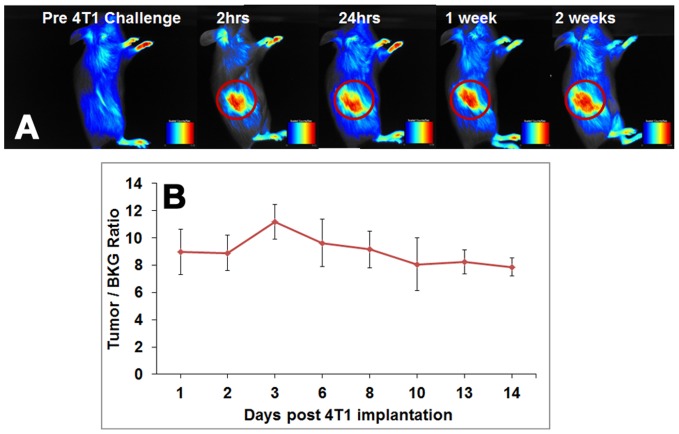
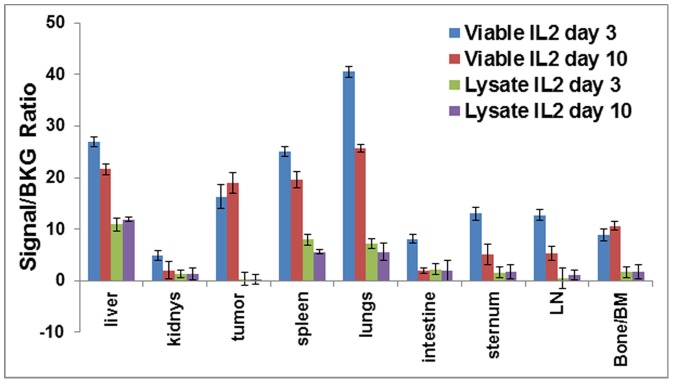
The overall objective of this study is to non-invasively image and assess tumor targeting and retention of directly labeled T-lymphocytes following their adoptive transfer in mice. T-lymphocytes obtained from draining lymph nodes of 4T1 (murine breast cancer cell) sensitized BALB/C mice were activated in-vitro with Bryostatin/Ionomycin for 18 hours, and were grown in the presence of Interleukin-2 for 6 days. T-lymphocytes were then directly labeled with 1,1-dioctadecyltetramethyl indotricarbocyanine Iodide (DiR), a lipophilic near infrared fluorescent dye that labels the cell membrane. Assays for viability, proliferation, and function of labeled T-lymphocytes showed that they were unaffected by DiR labeling. The DiR labeled cells were injected via tail vein in mice bearing 4T1 tumors in the flank. In some cases labeled 4T1 specific T-lymphocytes were injected a week before 4T1 tumor cell implantation. Multi-spectral in vivo fluorescence imaging was done to subtract the autofluorescence and isolate the near infrared signal carried by the T-lymphocytes. In recipient mice with established 4T1 tumors, labeled 4T1 specific T-lymphocytes showed marked tumor retention, which peaked 6 days post infusion and persisted at the tumor site for up to 3 weeks. When 4T1 tumor cells were implanted 1-week post-infusion of labeled T-lymphocytes, T-lymphocytes responded to the immunologic challenge and accumulated at the site of 4T1 cell implantation within two hours and the signal persisted for 2 more weeks. Tumor accumulation of labeled 4T1 specific T-lymphocytes was absent in mice bearing Meth A sarcoma tumors. When lysate of 4T1 specific labeled T-lymphocytes was injected into 4T1 tumor bearing mice the near infrared signal was not detected at the tumor site. In conclusion, our validated results confirm that the near infrared signal detected at the tumor site represents the DiR labeled 4T1 specific viable T-lymphocytes and their response to immunologic challenge can be imaged in vivo.


Conflict of interest statement

Competing Interests: The authors have declared that no competing interests exist.

Figures

Figure 1
Figure 1. Percent viability of T cells labeled with various concentrations of DiR measured using ATP based luminescent assay.
Bryostatin/Ionomycin (B/I) activated 4T1-cells grown in IL-2 were labeled on day 6 of their ex vivo expansion, which is day-0 of labeling. Viability of T-cells on 1, 4 and 7 days post-labeling were compared with unlabeled cells on respective days and expressed as percent viability. T-test was used to compare the significant differences (p<0.05) in the cell viability between day 1 versus day 7 (*) and day 4 versus day 7 (#). Average ± SD from three different assays are shown in the graph.
Figure 2
Figure 2. Fold increase in cell numbers measured by viable cell counts following ex vivo activation.
Cell numbers were highest on day 6 and this time point was selected for DiR labeling. Following labeling, no significant differences (p<0.05) in cell proliferation between DiR labeled and unlabeled cells were found.
Figure 3
Figure 3. Interferon-gamma assay.
The amount of interferon-gamma (IFN- γ) released into the supernatant (A) and in the mouse serum (B) by the 4T1 specific T lymphocytes are shown (mean ± SD). This demonstrates the 4T1 cell specificity and functioning of T lymphocytes are unaffected, both in vitro as well as in vivo, by the DiR labeling.
Figure 4
Figure 4. NIR fluorescence imaging of IL-2 grown T-cell trafficking.
Homing of 4T1 sensitized DiR labeled viable cells to 4T1 tumor site was seen as early as 2 hours post T-cell administration (A). Fluorescent signal was not detected at the tumor site in animals injected with the cell lysates of DiR labeled IL-2 grown T-cells (B). Quantitation of Tumor/Background ratios show, T-cells localized at the tumor site from 2 hours posts T-cell administration, peaked on day 3 and persisted up to 14 days in the animal (C). While in case of IL-2 lysate, there was no localization of 4T1 specific T cells at the tumor site.
Figure 5
Figure 5. T-cell trafficking following delayed immunologic challenge.
4T1 sensitized T cells expanded in IL-2 containing media, were injected in naive mice one week prior to 4T1 challenge. (A) The labeled 4T1 specific T cells were able to leave the lymphoid compartments and localize within 2 hours at the site of an immunologic challenge induced by 4T1 cell implantation in the flank. (B) Tumor/Background ratios obtained from mice injected with T cells and implanted with 4T1 cells a week later.
Figure 6
Figure 6. Ex vivo validation of mice injected with viable cells or T cell lysate.
NIR signal from organs harvested from mice show 4T1 tumor specific accumulation of viable 4T1 sensitized T-lymphocytes, which is absent with T cell lysates.
Figure 7
Figure 7. Histologic evaluation of T-cell accumulation in 4T1 tumors.
4T1 tumor bearing mice were injected with activated T-cells and the tumor sections were stained for CD69 activated T-cells (red color) marker and F4/80 macrophage (green color) marker (Figures-A & B). Images of 4T1 tumor sections obtained from mouse bearing 4T1 tumor but not injected with activated T cells, stained for CD69 and F4/80 markers (Figures-C & D).

References

    1. Dudley ME, Wunderlich JR, Yang JC, Sherry RM, Topalian SL, et al. (2005) Adoptive cell transfer therapy following non-myeloablative but lymphodepleting chemotherapy for the treatment of patients with refractory metastatic melanoma. J Clin Oncol 23: 2346–2357. - PMC - PubMed
    1. Yee C, Thompson JA, Byrd D, Riddell SR, Roche P, et al. (2002) Adoptive T cell therapy using antigen-specific CD8+ T cell clones for the treatment of patients with metastatic melanoma: in vivo persistence, migration, and antitumor effect of transferred T cells. Proc Natl Acad Sci U S A 99: 16168–16173. - PMC - PubMed
    1. Morgan RA, Dudley ME, Wunderlich JR, Hughes MS, Yang JC, et al. (2006) Cancer regression in patients after transfer of genetically engineered lymphocytes. Science 314: 126–129. - PMC - PubMed
    1. Le HK, Graham L, Miller CH, Kmieciak M, Manjili MH, et al. (2009) Incubation of antigen-sensitized T lymphocytes activated with bryostatin 1+ ionomycin in IL-7+IL-15 increases yield of cells capable of inducing regression of melanoma metastases compared to culture in IL-2. Cancer Immunol Immunother 58: 1565–1576. - PMC - PubMed
    1. Tuttle TM, Bethke KP, Inge TH, Mccrady CW, Pettit GR, et al. (1992) Bryostatin 1-activated T cells can traffic and mediate tumor regression. J Surg Res 52: 543–548. - PubMed

Publication types

MeSH terms