

Change in drusen area over time compared using spectral-domain optical coherence tomography and color fundus imaging
- PMID: 25335982
- PMCID: PMC4245070
- DOI: 10.1167/iovs.14-15273
Change in drusen area over time compared using spectral-domain optical coherence tomography and color fundus imaging
Abstract
Purpose: To investigate the relationship between drusen areas measured with color fundus images (CFIs) and those with spectral-domain optical coherence tomography (SDOCT).
Methods: Forty-two eyes from thirty patients with drusen in the absence of geographic atrophy were recruited to a prospective study. Digital color fundus images and SDOCT images were obtained at baseline and at follow-up visits at 3 and 6 months. Registered, matched circles centered on the fovea with diameters of 3 mm and 5 mm were identified on both CFIs and SDOCT images. Spectral-domain OCT drusen measurements were obtained using a commercially available proprietary algorithm. Drusen boundaries on CFIs were traced manually at the Doheny Eye Institute Image Reading Center.
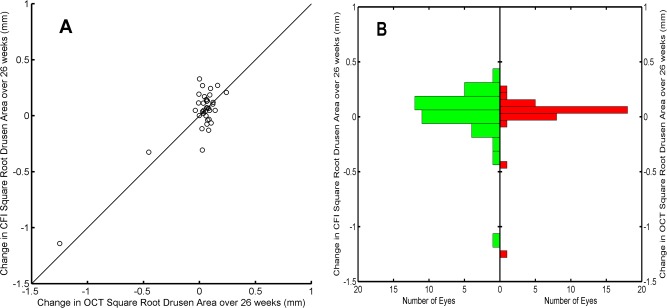
Results: Mean square root drusen area (SQDA) measurements for the 3-mm circles on the SDOCT images were 1.451 mm at baseline and 1.464 mm at week 26, whereas the measurements on CFIs were 1.555 mm at baseline and 1.584 mm at week 26. Mean SQDA measurements from CFIs were larger than those from the SDOCT measurements at all time points (P = 0.004 at baseline, P = 0.003 at 26 weeks). Changes in SQDA over 26 weeks measured with SDOCT were not different from those measured with CFIs (mean difference = 0.014 mm, P = 0.5).
Conclusions: Spectral-domain OCT drusen area measurements were smaller than the measurements obtained from CFIs. However, there were no differences in the change in drusen area over time between the two imaging modalities. Spectral-domain OCT measurements were considerably more sensitive in assessing drusen area changes.
Keywords: age-related macular degeneration; color fundus photography; drusen; optical coherence tomography.
Copyright 2014 The Association for Research in Vision and Ophthalmology, Inc.
Figures


References
-
- Klein R, Klein BE, Tomany SC, Meuer SM, Huang GH. Ten-year incidence and progression of age-related maculopathy: The Beaver Dam eye study. Ophthalmology. 2002; 109: 1767–1779. - PubMed
-
- Bressler SB, Maguire MG, Bressler NM, Fine SL. Relationship of drusen and abnormalities of the retinal pigment epithelium to the prognosis of neovascular macular degeneration. The Macular Photocoagulation Study group. Arch Ophthalmol. 1990; 108: 1442–1447. - PubMed
-
- van Leeuwen R, Klaver CC, Vingerling JR, Hofman A, de Jong PT. The risk and natural course of age-related maculopathy: follow-up at 6 1/2 years in the Rotterdam study. Arch Ophthalmol. 2003; 121: 519–526. - PubMed
-
- Wang JJ, Foran S, Smith W, Mitchell P. Risk of age-related macular degeneration in eyes with macular drusen or hyperpigmentation: the Blue Mountains Eye Study cohort. Arch Ophthalmol. 2003; 121: 658–663. - PubMed
Publication types
MeSH terms
LinkOut - more resources
Full Text Sources
Other Literature Sources
Medical
