. 2015 Feb;33(2):601-14.
doi: 10.1002/stem.1867.

Human mesenchymal stromal cells attenuate graft-versus-host disease and maintain graft-versus-leukemia activity following experimental allogeneic bone marrow transplantation

Affiliations

Human mesenchymal stromal cells attenuate graft-versus-host disease and maintain graft-versus-leukemia activity following experimental allogeneic bone marrow transplantation

Jeffery J Auletta et al. Stem Cells. 2015 Feb.

Abstract

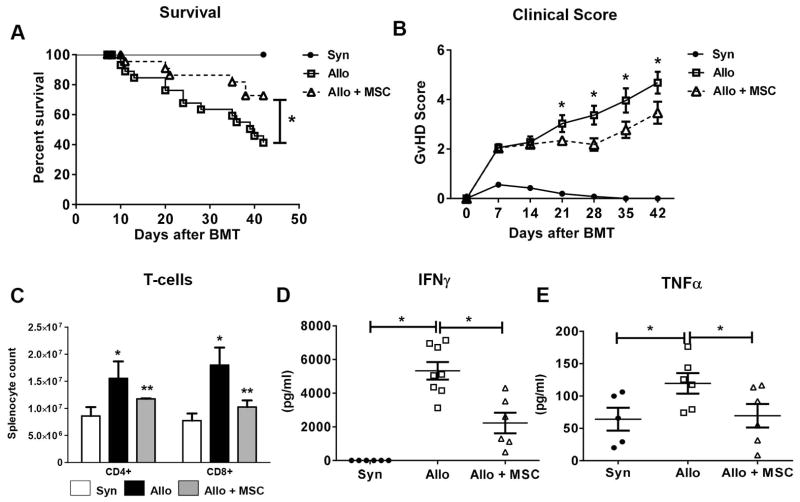
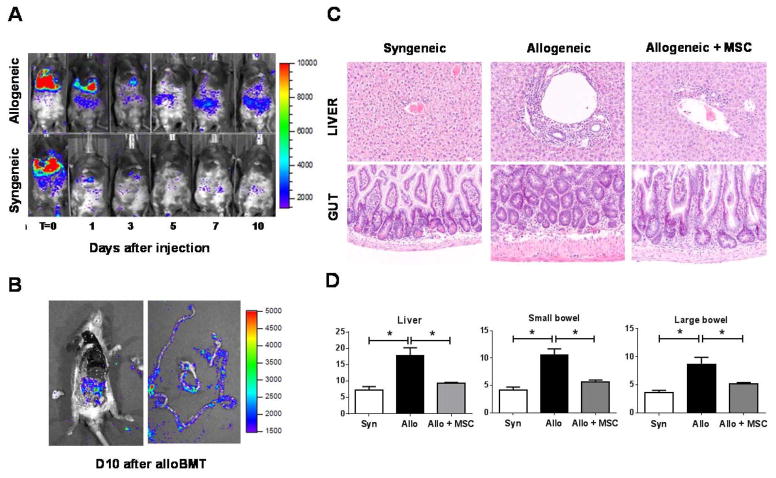
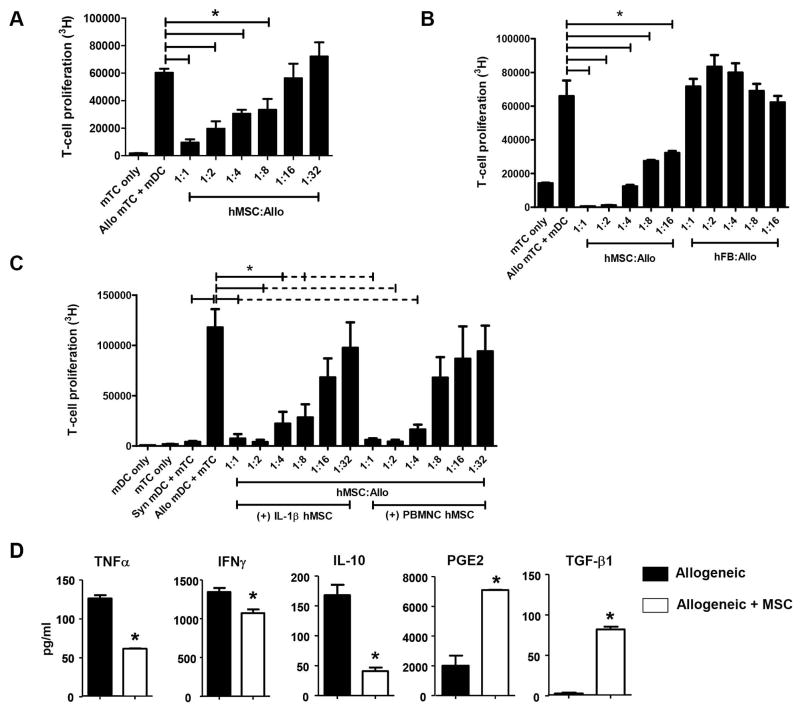
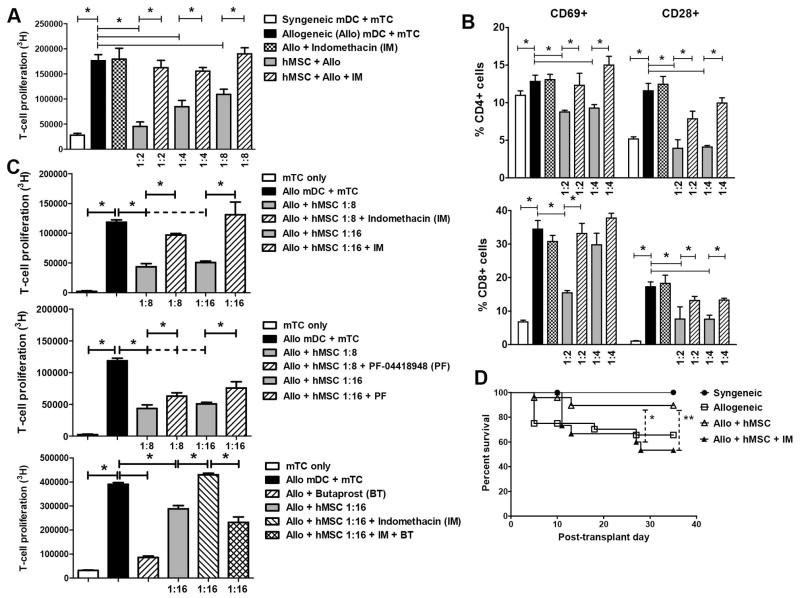
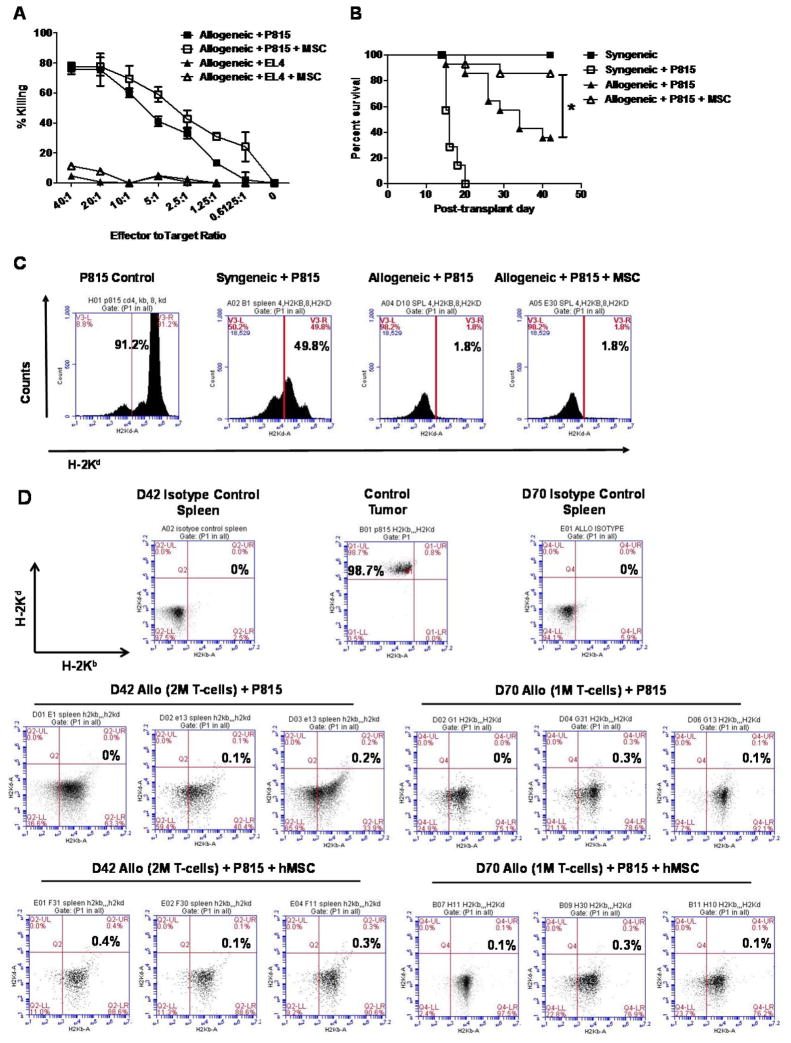
We sought to define the effects and underlying mechanisms of human, marrow-derived mesenchymal stromal cells (hMSCs) on graft-versus-host disease (GvHD) and graft-versus-leukemia (GvL) activity. Irradiated B6D2F1 mice given C57BL/6 BM and splenic T cells and treated with hMSCs had reduced systemic GvHD, donor T-cell expansion, and serum TNFα and IFNγ levels. Bioluminescence imaging demonstrated that hMSCs redistributed from lungs to abdominal organs within 72 hours, and target tissues harvested from hMSC-treated allogeneic BMT (alloBMT) mice had less GvHD than untreated controls. Cryoimaging more precisely revealed that hMSCs preferentially distributed to splenic marginal zones and regulated T-cell expansion in the white pulp. Importantly, hMSCs had no effect on in vitro cytotoxic T-cell activity and preserved potent GvL effects in vivo. Mixed leukocyte cultures containing hMSCs exhibited decreased T-cell proliferation, reduced TNFα, IFNγ, and IL-10 but increased PGE2 levels. Indomethacin and E-prostanoid 2 (EP2) receptor antagonisms both reversed while EP2 agonism restored hMSC-mediated in vitro T-cell suppression, confirming the role for PGE2 . Furthermore, cyclo-oxygenase inhibition following alloBMT abrogated the protective effects of hMSCs. Together, our data show that hMSCs preserve GvL activity and attenuate GvHD and reveal that hMSC biodistribute to secondary lymphoid organs wherein they attenuate alloreactive T-cell proliferation likely through PGE2 induction.

Keywords: Graft-versus-host disease; Graft-versus-leukemia; Mesenchymal stromal cells.


Conflict of interest statement

Conflict-of-interest disclosure: The authors declare no competing financial interests.

Figures

Figure 1
Figure 1. Human MSC infusions (hMSCs) regulate in vivo T-cell expansion, pro-inflammatory cytokine secretion and systemic GvHD following alloBMT
(A) hMSC infusions reduce systemic GvHD following alloBMT as measured by survival. Data are expressed as mean ± SEM and represent three combined transplant experiments [(n= 15 to 30 mice per experimental group; * p < 0.05 allo control vs. allo + MSC by Mantel-Cox log-rank test (survival) and unpaired t-test (clinical score)]. (B) hMSC infusions improve clinical GvHD scores in alloBMT mice. Combined clinical scores (mean ± SEM) from three separate transplant experiments are depicted. Asterisks (*) indicate significant differences in mean clinical GvHD scores between indicted alloBMT groups at listed post-transplant times (p<0.05, unpaired t-test). (C) hMSC infusions result in decreased donor T-cell expansion at D10. Data are expressed as mean ± SEM and are from one of three representative independent experiments (n=3 to 6 mice per group; * p < 0.05 syn vs. allo control; ** p < 0.05 allo control vs. allo + MSC by Mann-Whitney test). (D, E) AlloBMT mice receiving MSC infusions have decreased levels of circulating IFNγ (D) and TNFα (E). Whole blood was collected, serum separated and ELISA used to measure cytokine levels from individualized mice at D7 (IFNγ) and D10 (TNFα). Data are expressed as mean ± SEM and are from one of three independent experiments (n=5 to 6 mice per experimental group; * p < 0.05 for indicated comparisons by Mann-Whitney test).
Figure 2
Figure 2. hMSCs migrate to abdominal organs and attenuate target-tissue GvHD cytotoxicity
(A) Serial bioluminescence imaging (BLI) demonstrates that hMSCs home to the gastrointestinal tract in alloBMT mice. Data from one of three similar independent experiments is shown. (B) Post-mortem examination of intestines dissected from alloBMT mice that received hMSC infusions on D1 and D4. The mouse was euthanized and abdominal tissues dissected on D10. BLI was performed on dissected intestines. (C, D) Early reduction in proinflammatory T-cell expansion and cytokine induction as shown in Figure 1 associates with decreases in GvHD-associated histopathology in liver and bowel (C) and reduced GvHD organ histology scores (D). Organs harvested from five individual mice per transplant group were analyzed for GvHD severity at D10. Data are expressed as mean ± SEM and represent one of two similar experiments (n=5 mice per experimental group; * p < 0.01 and ** p < 0.05 for indicated comparisons by Mann-Whitney test).
Figure 3
Figure 3. Bio-distribution of hMSCs and murine T-cells (mTCs) within allogeneic and syngeneic transplant-recipient spleens
(A, B) Using cryo-imaging red Qdot-labeled hMSCs (rendered in gold) appear initially in the lung (A) and liver 6 h after tail-vein injection on D1 after BMT and then migrate to spleen in both syngeneic (not shown) and allogeneic (shown) BMT recipient mice by 24 h post-injection (D2 after BMT, cells are visible in the cut-away when zoomed) (B). (C) Bright field imaging shows splenic white (“WP”) and red (“RP”) pulp architecture. (D, E) Marginal zones in syngeneic (D) and allogeneic (E) animals are outlined as dotted green lines 96 h post hMSC (yellow shapes) infusion. (F, G) Fluorescent imaging at 96 h shows green CFSE-labeled mTCs in white pulp regions and red hMSCs within the marginal zones in both syngeneic (F) and allogeneic (G) transplant mice. (H, I) Three-dimensional (3D) rendering of WP shows that less hMSCs (gold beads) localize to the marginal zone following syngeneic (H) than after allogeneic (I) BMT. (J) Numbers of hMSCs homing to the spleen in allogeneic and syngeneic transplant mice were quantified after 96 h post-MSC infusion. Data are presented as mean ± SEM and represent one of two independent and similar experiments (n=3 mice per experimental group, per time point; * p < 0.05 for indicated comparisons by Mann-Whitney test). (K, L) The presence of hMSCs in the spleen was confirmed by IHC using a monoclonal anti-human antibody to β-2-microglobulin (K) and semi-quantitative BLI (L). Representative photomicrographs are shown from one of three IHC slides per experimental group. BLI data are representative of 4 mice per experimental group, * p = 0.05, for indicated comparisons by Mann-Whitney test).
Figure 4
Figure 4. Labeled mTCs in alloreactive mice retain CFSE intensity in alloBMT mice receiving hMSCs
(A) Volume rendering of CFSE fluorescence shows WP distribution of mTCs in syngeneic (“syn”), allogeneic (“allo”), and hMSC-infused allogeneic spleens (“allo + MSC”) at indicated time points post-transplant. (B) Probability density function (PDF) of CFSE fluorescence intensity per cell was used to estimate the fraction of bright mTCs over all detected mTCs. Green-shaded areas in histograms represent the percentages of mTC that retain high CFSE intensity (low mTC proliferation), while blue-shaded areas represent percentages of mTCs with low CFSE intensity (high mTC proliferation). Each representative histogram is from an individual mouse within the indicated experimental group (n=3 mice per experimental group). Data from one of two independent experiments is shown. (C) Quantitative analyses of spleen and white pulp volumes (in mm3) and the fraction of WP to total splenic volume (in %) are shown (n=3 mice per experimental group per time point; * p = 0.05, for indicated comparisons by Mann-Whitney test).
Figure 5
Figure 5. Human MSCs modulate in vitro mTC alloreactivity in vitro
(A) hMSCs inhibit murine T-cell alloreactivity in a dose-dependent fashion. (B) MSCs are unique stromal cells that mediate inhibition of murine T-cell alloreactivity. Mixed leukocyte cultures (MLCs) were prepared as described above using human fibroblasts (hFB) in indicated hFB-to-mTC ratios. (C) MSCs stimulated with either human IL-β (10 pg/ml) or 20,000 human PBMCs inhibit in vitro T-cell alloreactivity. (D) MSC-mediated suppression of in vitro mTC proliferation correlates with changes in T-cell cytokine production. mTC proliferation (A, B, C), cytokine production and surface T-cell activation expression (D) were measured in triplicate from one of three to four independent experiments using hMSCs from different donors. Data are expressed as means ± SEM (* p < 0.05 and ** p < 0.001 for indicated comparisons by Mann-Whitney test).
Figure 6
Figure 6. PGE2 mediates the immunomodulatory effects of hMSCs on T-cell alloreactivity
(A, B) Indomethacin reverses MSC-mediated inhibition of mTC proliferation (A) and surface activation markers (B). B6 splenic mTCs were co-cultured with syngeneic (B6) and allogeneic (B6D2F1) splenic-derived DCs in the presence or absence of hMSCs at indicated hMSC-to-mTC ratios. Indomethacin (IM, 1 μg/ml) or diluents was added to some co-culture wells. Mouse CD4+ and CD8+ T-cells were collected after 72h, stained with fluorescently-labeled conjugate antibodies and analyzed by flow cytometry for cell surface expression of CD28 and CD69. Data are expressed as mean ± SEM from one of at least two independent experiments (* p < 0.05 for indicated comparisons by Mann-Whitney test). (C) Effects of hMSC-mediated on TC alloreactivity are both COX- and EP2-dependent, suggesting that PGE2 is necessary and sufficient in mediating hMSC TC immunomodulation. EP2 antagonism reverses hMSC-mediated TC attenuation albeit not to the same degree as COX inhibition. The EP2 antagonist, PF-04418948 (PF, 2 μg/ml), IM (1 μg/ml) and the EP2 agonist, butaprost (BT, 2 μg/ml), were added to defined hMSCs-to-TC ratios and subsequent TC proliferation at 72 h was measured. Each indicated condition was measured in triplicate, and results shown are from one of two independent experiments (* p < 0.05 for indicated comparisons by Mann-Whitney test). (D) In addition to 1M hMSCs via tail-injection on D1 and D4, allogeneic transplant recipient mice also received 20 μg indomethacin (IM) via intraperitoneal injection on Days 1–7 post-BMT. Data shown are combined results from two separate independent transplant experiments. (n = 8 to 12 mice per group, * p < 0.05 and ** p < 0.05 by Mann-Whitney test for indicated percent survival comparisons between “Allo + hMSC” and “Allo + hMSC + IM” at D28 and D35, respectively).
Figure 7
Figure 7. MSCs infusions preserve in vitro cytotoxic T-lymphocyte (CTL) activity and prolong survival in alloBMT following in vivo leukemic challenge
(A) MSCs do not interfere with ex vivo CTL-directed against P815 tumor cells. Allogeneic B6 T cells were stimulated in bulk by splenic-derived B6D2F1 DCs with or without hMSCs at a MSC-to-mTC ratio of 1:4. CTLs were subsequently isolated using Ficoll gradient and co-cultured with either P815 (H-2Kd) or EL4 (H-2Kb) tumor cell lines and cytolytic activity. Data are expressed as mean ± SEM and represent one of two similar, independent experiments. (B, C) MSC infusions preserve alloreactive graft-versus-leukemia (GvL) activity in alloBMT mice following P815 challenge as measured by survival (B) and minimal residual disease (MRD) using flow cytometry (C). Data from one of two independent experiments is shown. (n=8 to 16 mice per group; *p < 0.05 allo controls + P815 vs. allo + P815 + MSC by Mantel-Cox log-rank test). (D) GvL activity is preserved late post-transplant (D42) following hMSC infusions in allogeneic transplant mice challenged with P815 at lower T-cell doses (D70). AlloBMT mice received either one (1M) or two (2M) million B6 TCs on D0 and then 1M hMSCs or diluent only via tail-vein injection on D1 and D4. Representative FACS dot plots of H-2Kd-stained splenocytes from individual mice from two independent experiments are shown. Data for syngeneic mice were obtained at D14 given that syngeneic mice challenged with P815 uniformly die from tumor by D21.

References

    1. Barrett AJ. Understanding and harnessing the graft-versus-leukaemia effect. Br J Haematol. 2008;142:877–888. - PubMed
    1. Pasquini MC, Wang Z. Current use and outcome of hematopoietic stem cell transplantation: CIBMTR Summary Slides, 2012. 2012 Available at: http://www.cibmtr.org.
    1. Auletta JJ, Cooke KR. Bone marrow transplantation: new approaches to immunosuppression and management of acute graft-versus-host disease. Curr Opin Pediatr. 2009;21:30–38. - PubMed
    1. Dominici M, Le Blanc K, Mueller I, et al. Minimal criteria for defining multipotent mesenchymal stromal cells. The International Society for Cellular Therapy position statement. Cytotherapy. 2006;8:315–317. - PubMed
    1. Caplan AI, Dennis JE. Mesenchymal stem cells as trophic mediators. J Cell Biochem. 2006;98:1076–1084. - PubMed

Publication types