

Spatial patterns of structural brain changes in type 2 diabetic patients and their longitudinal progression with intensive control of blood glucose
- PMID: 25336747
- PMCID: PMC4274773
- DOI: 10.2337/dc14-1196
Spatial patterns of structural brain changes in type 2 diabetic patients and their longitudinal progression with intensive control of blood glucose
Abstract
Objective: Understanding the effect of diabetes as well as of alternative treatment strategies on cerebral structure is critical for the development of targeted interventions against accelerated neurodegeneration in type 2 diabetes. We investigated whether diabetes characteristics were associated with spatially specific patterns of brain changes and whether those patterns were affected by intensive versus standard glycemic treatment.
Research design and methods: Using baseline MRIs of 488 participants with type 2 diabetes from the Action to Control Cardiovascular Risk in Diabetes-Memory in Diabetes (ACCORD-MIND) study, we applied a new voxel-based analysis methodology to identify spatially specific patterns of gray matter and white matter volume loss related to diabetes duration and HbA1c. The longitudinal analysis used 40-month follow-up data to evaluate differences in progression of volume loss between intensive and standard glycemic treatment arms.
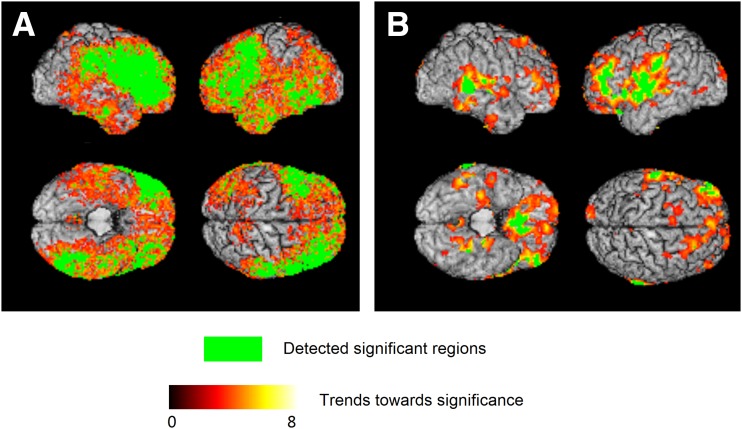
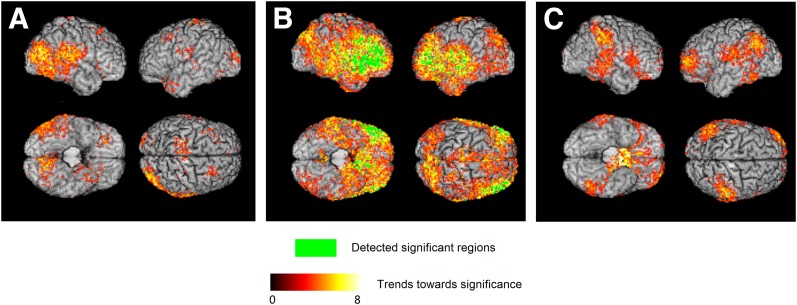
Results: Participants with longer diabetes duration had significantly lower gray matter volumes, primarily in certain regions in the frontal and temporal lobes. The longitudinal analysis of treatment effects revealed a heterogeneous pattern of decelerated loss of gray matter volume associated with intensive glycemic treatment. Intensive treatment decelerated volume loss, particularly in regions adjacent to those cross-sectionally associated with diabetes duration. No significant relationship between low versus high baseline HbA1c levels and brain changes was found. Finally, regions in which cognitive change was associated with longitudinal volume loss had only small overlap with regions related to diabetes duration and to treatment effects.
Conclusions: Applying advanced quantitative image pattern analysis methods on longitudinal MRI data of a large sample of patients with type 2 diabetes, we demonstrate that there are spatially specific patterns of brain changes that vary by diabetes characteristics and that the progression of gray matter volume loss is slowed by intensive glycemic treatment, particularly in regions adjacent to areas affected by diabetes.
© 2015 by the American Diabetes Association. Readers may use this article as long as the work is properly cited, the use is educational and not for profit, and the work is not altered.
Figures
References
-
- Biessels GJ, van der Heide LP, Kamal A, Bleys RL, Gispen WH. Ageing and diabetes: implications for brain function. Eur J Pharmacol 2002;441:1–14 - PubMed
-
- Allen KV, Frier BM, Strachan MW. The relationship between type 2 diabetes and cognitive dysfunction: longitudinal studies and their methodological limitations. Eur J Pharmacol 2004;490:169–175 - PubMed
-
- Biessels GJ, Staekenborg S, Brunner E, Brayne C, Scheltens P. Risk of dementia in diabetes mellitus: a systematic review. Lancet Neurol 2006;5:64–74 - PubMed
-
- Scheltens P, Fox N, Barkhof F, De Carli C. Structural magnetic resonance imaging in the practical assessment of dementia: beyond exclusion. Lancet Neurol 2002;1:13–21 - PubMed
Publication types
MeSH terms
Substances
Grants and funding
LinkOut - more resources
Full Text Sources
Other Literature Sources
Medical
