. 2014 Sep 23:2:e576.
doi: 10.7717/peerj.576. eCollection 2014.

Error estimates for the analysis of differential expression from RNA-seq count data

Affiliations

Error estimates for the analysis of differential expression from RNA-seq count data

Conrad J Burden et al. PeerJ. .

Abstract

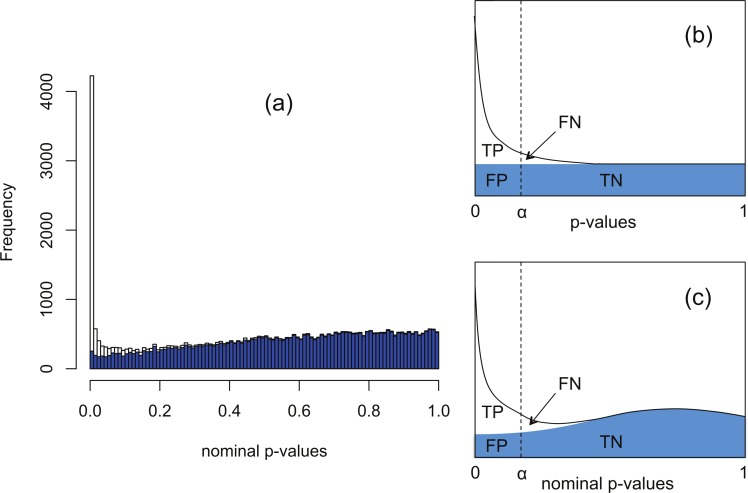
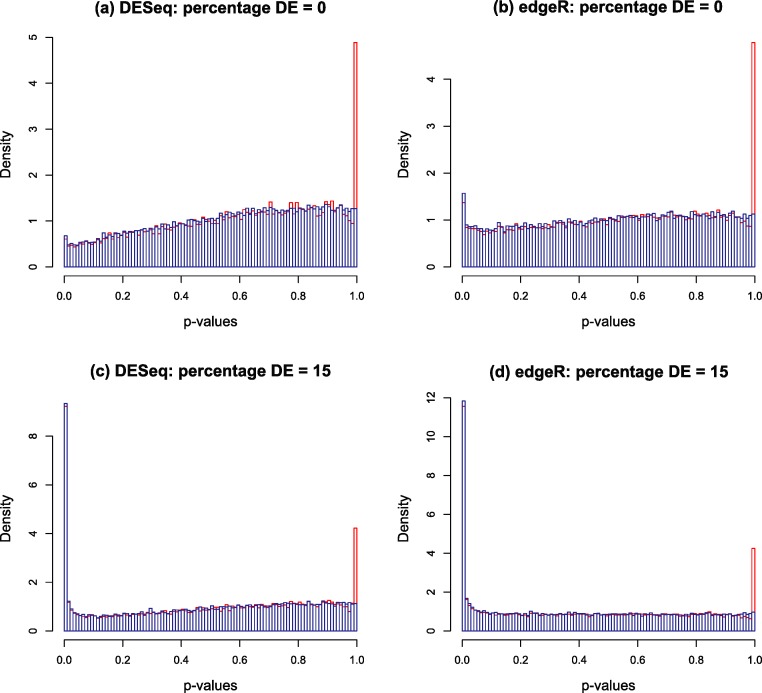
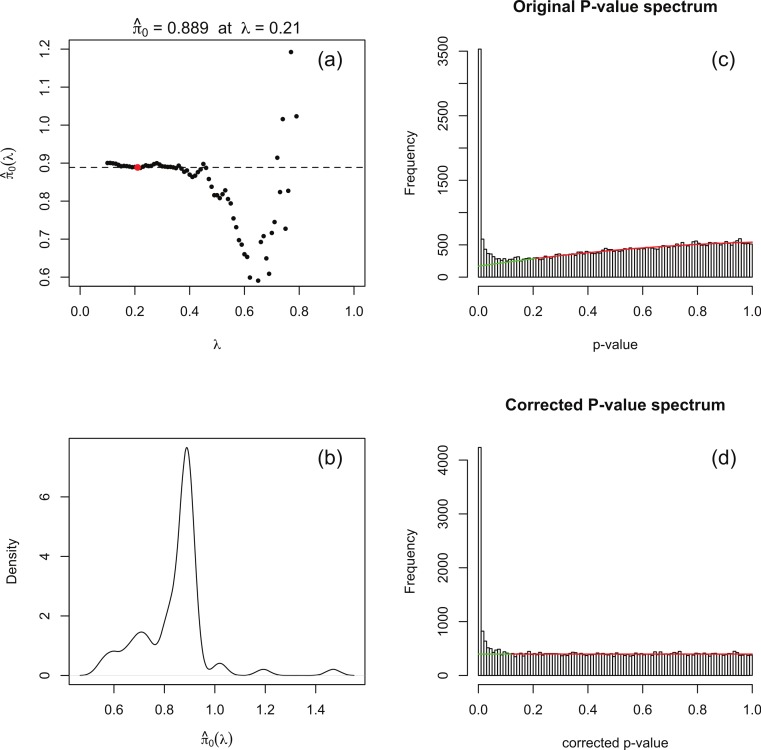
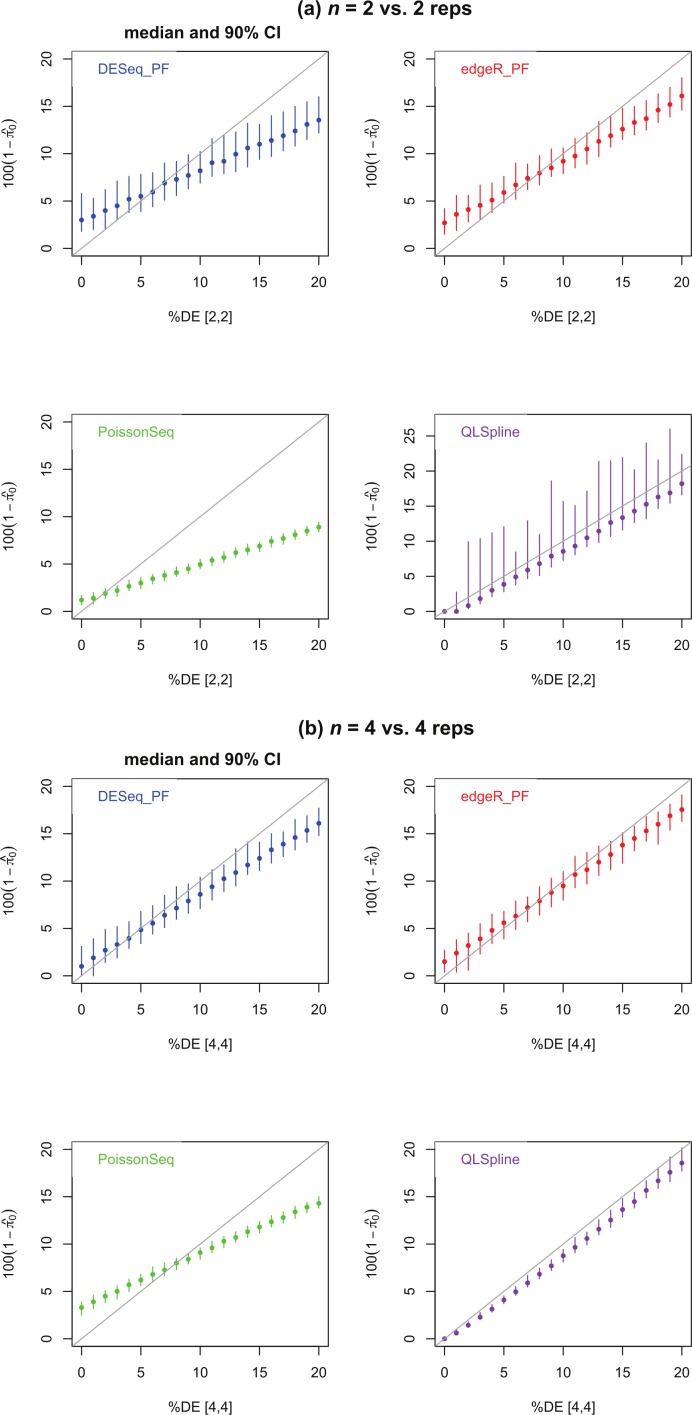
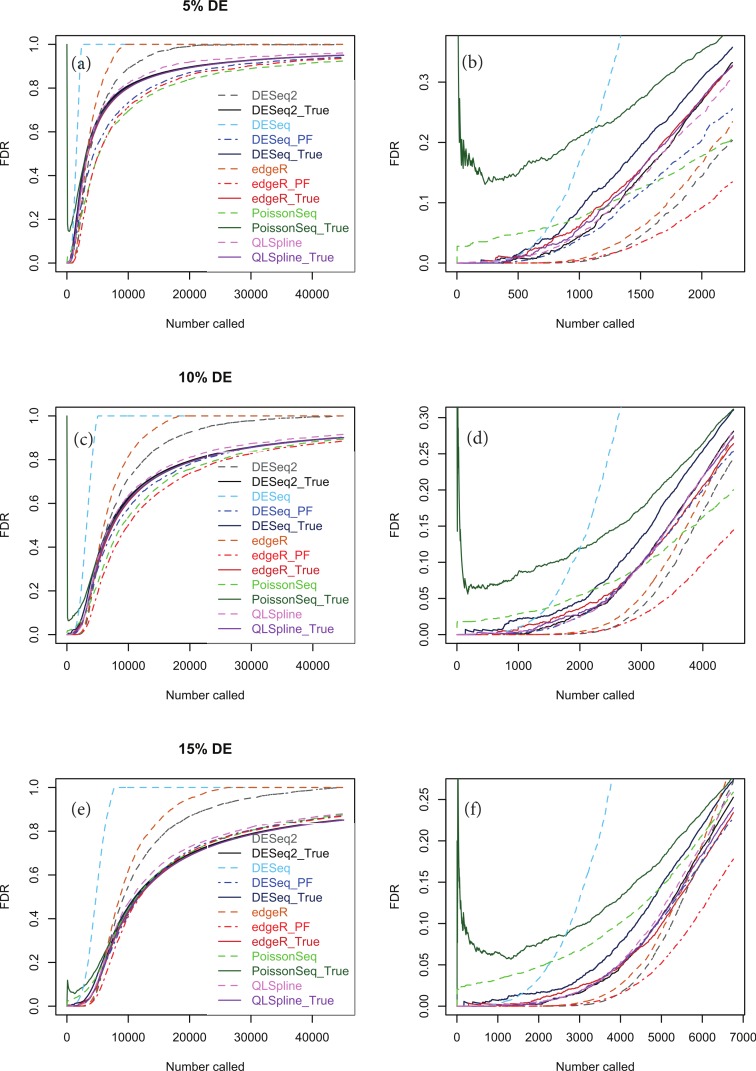
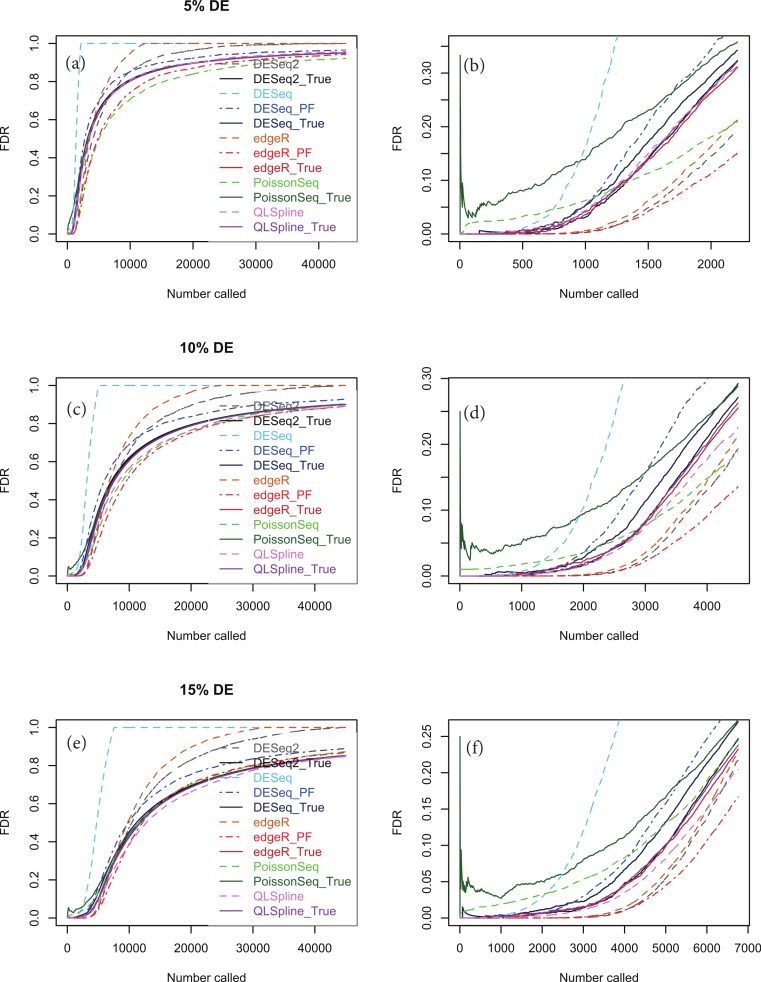
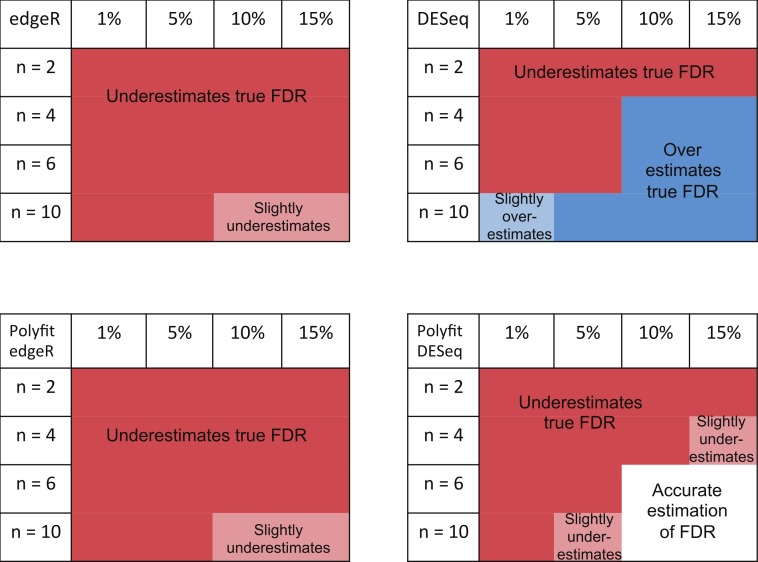
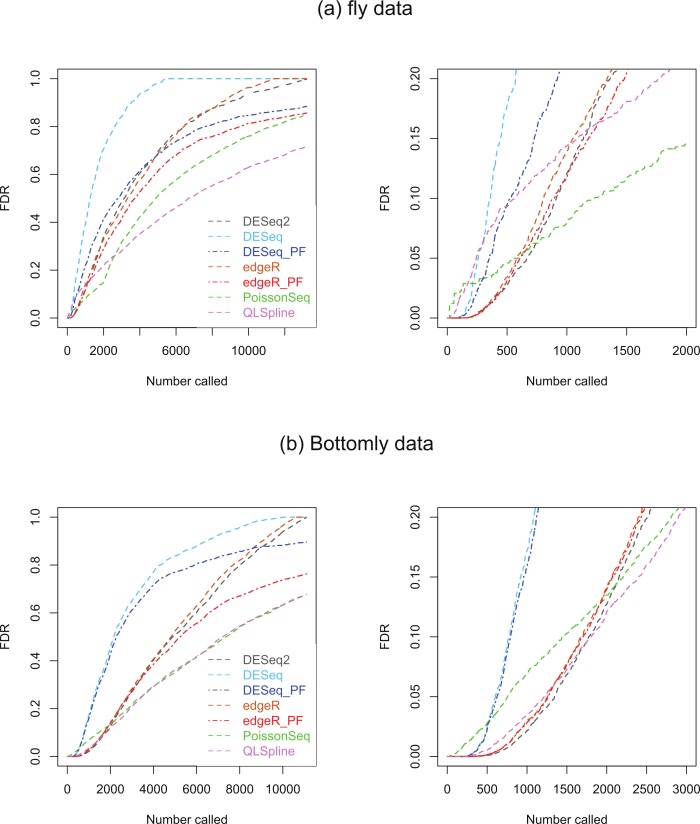
Background. A number of algorithms exist for analysing RNA-sequencing data to infer profiles of differential gene expression. Problems inherent in building algorithms around statistical models of over dispersed count data are formidable and frequently lead to non-uniform p-value distributions for null-hypothesis data and to inaccurate estimates of false discovery rates (FDRs). This can lead to an inaccurate measure of significance and loss of power to detect differential expression. Results. We use synthetic and real biological data to assess the ability of several available R packages to accurately estimate FDRs. The packages surveyed are based on statistical models of overdispersed Poisson data and include edgeR, DESeq, DESeq2, PoissonSeq and QuasiSeq. Also tested is an add-on package to edgeR and DESeq which we introduce called Polyfit. Polyfit aims to address the problem of a non-uniform null p-value distribution for two-class datasets by adapting the Storey-Tibshirani procedure. Conclusions. We find the best performing package in the sense that it achieves a low FDR which is accurately estimated over the full range of p-values, albeit with a very slow run time, is the QLSpline implementation of QuasiSeq. This finding holds provided the number of biological replicates in each condition is at least 4. The next best performing packages are edgeR and DESeq2. When the number of biological replicates is sufficiently high, and within a range accessible to multiplexed experimental designs, the Polyfit extension improves the performance DESeq (for approximately 6 or more replicates per condition), making its performance comparable with that of edgeR and DESeq2 in our tests with synthetic data.

Keywords: Differential expression analysis; False discovery rates; RNA-seq.


Figures

Figure 1
Figure 1. The Polyfit procedure.
(A) Histogram of the nominal p-values calculated by DESeq for synthetic data RNA-seq with 15% genes up- or down-regulated. The shaded histogram superimposed is the 85% of transcripts which are unregulated. (B) Schematic representation of the Storey–Tibshirani procedure for correcting for multiple hypothesis testing, assuming correctly calculated p-values. (C) Schematic representation of the Storey–Tibshirani procedure adapted to RNA-seq data. By ‘nominal p-values’ we mean p-values as calculated by a computer package relying on a NB model using estimated parameters, such as DESeq or edgeR. (TP, true positives; FP, false positives; FN, false negatives; TN, true negatives at a specified significance point α.)
Figure 2
Figure 2. Nominal p-value histograms generated by DESeq (A and C) and edgeR (B and D) from synthetic data with no DE genes (A and B) and 15% differentially expressed genes (C and D).
Histograms are shown in red before the redistribution of the ‘flagpole’ at p = 1 and in blue after.
Figure 3
Figure 3
(A) Estimates of the fraction π0 of genes not DE obtained by fitting a quadratic function to the original input (without the flagpole) p-value histogram over the interval [λ, 1]. (B) Density plot of obtained estimates πˆ0. The optimal λopt (red dot in (A)) is obtained by choosing the πˆ0λ closest to the mode of the πˆ0 density. The mode is also indicated by the dotted line in (A). The original and corrected p-value histograms are shown in (C) and (D), together with optimally fitted quadratic in (C) and its image after correction in (D). The red part of the quadratic is the interval [λopt, 1] in (C) and its image in (D). This example is generated from synthetic data for which the true value of π0 is 0.85.
Figure 4
Figure 4. Estimated percentage 1001πˆ0 of DE genes for synthetic data representing (A) n = 2 replicates and (B) n = 4 replicates of NB data for two different conditions with a specified percentage of genes differentially expressed by at least a factor of 2 in the second condition.
Polyfit-DESeq and Polyfit-edgeR are labelled with the extension _ PF. Error bars are 90% confidence intervals and points are medians estimated from 100 independently generated datasets. To facilitate simulation of 100 datasets at each data point without undue computational cost, QLSpline was implemented with the option “Model = Poisson”.
Figure 5
Figure 5. True (solid curves) and estimated (broken curves) FDRs for n = 4 replicates of synthetic negative binomial data in each of two conditions with 5, 10 and 15% genes DE in the second conditon.
Plots (B), (D) and (F) are expanded views of the plots (A), (C) and (E) respectively covering a subset of genes up to a significance point roughly corresponding to the number of DE genes.
Figure 6
Figure 6. The same as Fig. 5, except that the synthetic data is generated from a Poisson-inverse-Gaussian distribution.
Figure 7
Figure 7. Summary of performance of the packages edgeR, DESeq and their Polyfit extensions in estimating the FDR for genes out to a significance point corresponding to half the number of truly DE genes.
(See plots (B), (D) and (F) in Fig. 5 and analogous plots in Figs. S1–S20). Experiments were done with n = 2, 4, 6 and 10 simulated replicates of synthetic data in which 1, 5, 10 and 15% of genes are DE.
Figure 8
Figure 8. Estimated FDRs for (A) the fly data consisting of n = 2 vs. 2 biological replicates of fly-embryo RNA and a total of 13,258 genes, and (B) the Bottomly data consisting of n = 10 vs. 11 biological replicates of mouse RNA and a total of 11,123 genes.
The right hand plots are expanded views of the first few thousand called genes.

References

    1. Anders S, Huber W. Differential expression analysis for sequence count data. Genome Biology. 2010;11(10):e576. doi: 10.1186/gb-2010-11-10-r106. - DOI - PMC - PubMed
    1. Benjamini Y, Hochberg Y. Controlling the false discovery rate: a practical and powerful approach to multiple testing. Proceedings of the Royal Statistical Society Series B. 1995;57:289–300.
    1. Bottomly D, Walter NAR, Hunter JE, Darakjian P, Kawane S, Buck KJ, Searles RP, Mooney M, McWeeney SK, Hitzemann R. Evaluating gene expression in C57BL/6J and DBA/2J mouse striatum using RNA-seq and microarrays. PLoS ONE. 2011;6:e576. doi: 10.1371/journal.pone.0017820. - DOI - PMC - PubMed
    1. Dillies M-A, Rau A, Aubert J, Hennequet-Antier C, Jeanmougin M, Servant N, Keime C, Marot G, Castel D, Estelle J, Guernec G, Jagla B, Jouneau L, Laloë D, Le Gall C, Schaëffer B, Le Crom S, Guedj M, Jaffrézic F. A comprehensive evaluation of normalization methods for illumina high-throughput RNA sequencing data analysis. Briefings in Bioinformatics. 2013;14:671–683. doi: 10.1093/bib/bbs046. - DOI - PubMed
    1. Dunne A, Pawitan Y, Doody L. Two-sided P-values from discrete asymmetric distributions based on uniformly most powerful unbiased tests. The Statistician. 1996;45(4):397–405. doi: 10.2307/2988542. - DOI