. 2014 Nov 19;136(46):16299-308.
doi: 10.1021/ja508478x. Epub 2014 Nov 5.

Broccoli: rapid selection of an RNA mimic of green fluorescent protein by fluorescence-based selection and directed evolution

Affiliations

Broccoli: rapid selection of an RNA mimic of green fluorescent protein by fluorescence-based selection and directed evolution

Grigory S Filonov et al. J Am Chem Soc. .

Abstract

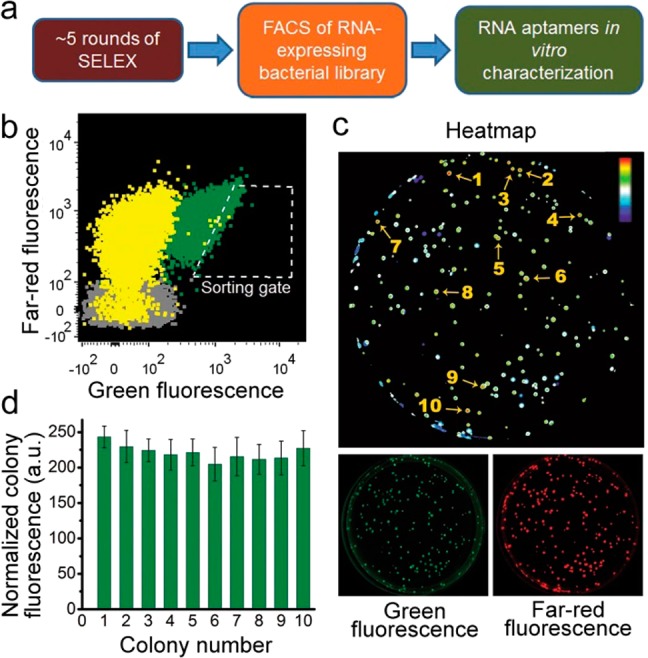
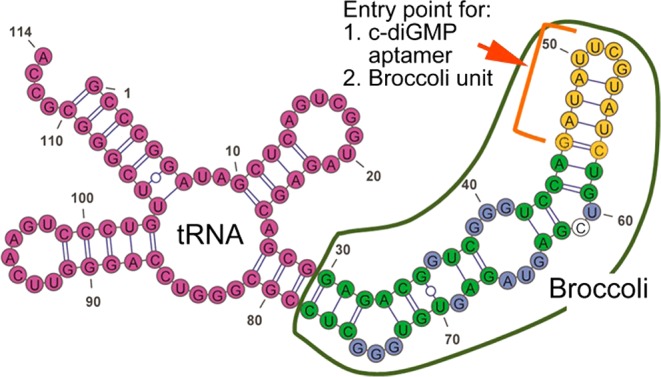
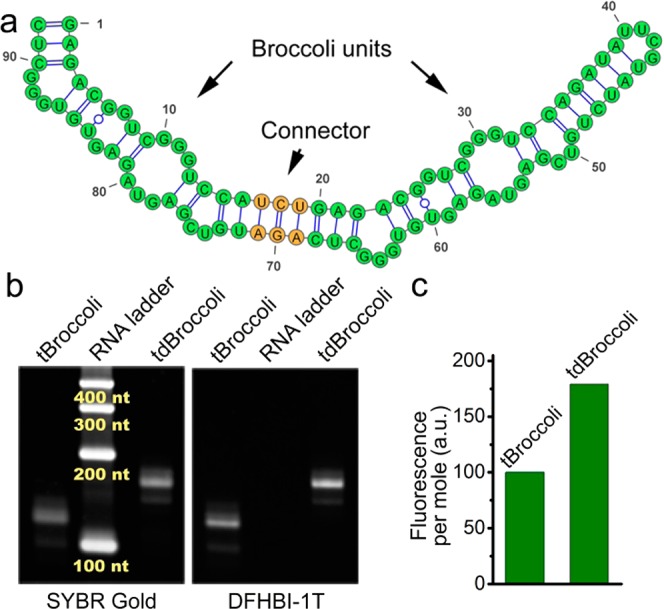
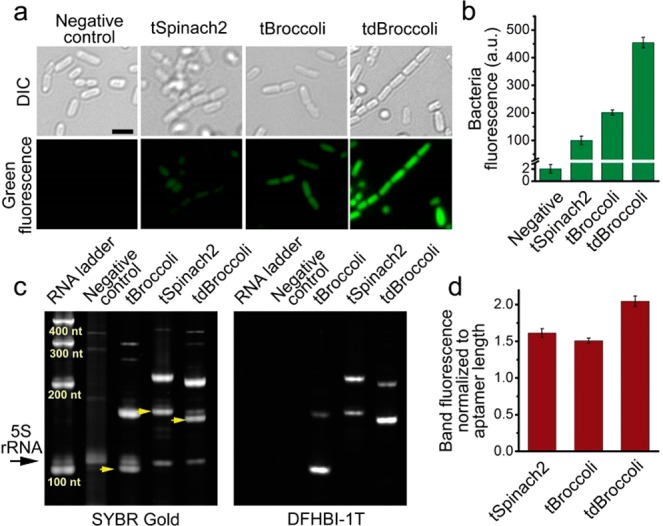
Genetically encoded fluorescent ribonucleic acids (RNAs) have diverse applications, including imaging RNA trafficking and as a component of RNA-based sensors that exhibit fluorescence upon binding small molecules in live cells. These RNAs include the Spinach and Spinach2 aptamers, which bind and activate the fluorescence of fluorophores similar to that found in green fluorescent protein. Although additional highly fluorescent RNA-fluorophore complexes would extend the utility of this technology, the identification of novel RNA-fluorophore complexes is difficult. Current approaches select aptamers on the basis of their ability to bind fluorophores, even though fluorophore binding alone is not sufficient to activate fluorescence. Additionally, aptamers require extensive mutagenesis to efficiently fold and exhibit fluorescence in living cells. Here we describe a platform for rapid generation of highly fluorescent RNA-fluorophore complexes that are optimized for function in cells. This procedure involves selection of aptamers on the basis of their binding to fluorophores, coupled with fluorescence-activated cell sorting (FACS) of millions of aptamers expressed in Escherichia coli. Promising aptamers are then further optimized using a FACS-based directed evolution approach. Using this approach, we identified several novel aptamers, including a 49-nt aptamer, Broccoli. Broccoli binds and activates the fluorescence of (Z)-4-(3,5-difluoro-4-hydroxybenzylidene)-1,2-dimethyl-1H-imidazol-5(4H)-one. Broccoli shows robust folding and green fluorescence in cells, and increased fluorescence relative to Spinach2. This reflects, in part, improved folding in the presence of low cytosolic magnesium concentrations. Thus, this novel fluorescence-based selection approach simplifies the generation of aptamers that are optimized for expression and performance in living cells.


Figures

Figure 1
Figure 1
Combined SELEX-FACS approach for rapid selection of RNA–fluorophore complexes from random libraries. (a) Schematic representation of the combined SELEX-FACS approach. SELEX is performed using a random library containing ∼1014 RNAs. SELEX is performed until the first round when the RNA pool begins to exhibit fluorescence upon incubation with the fluorophore. The RNAs are reverse-transcribed and cloned into a bacterial expression plasmid. The library is transformed into E. coli and the transformants are screened by FACS in the presence of DFHBI. This screening approach selects RNAs based exclusively on their in vivo fluorescence. (b) FACS dot plot showing the fluorescence distribution of E. coli transformed with a library containing the RNA pool from round six of SELEX. In this experiment, E. coli expressing the SELEX round 6 RNA library (yellow population) was preincubated with 40 μM DFHBI and then sorted using the indicated gate. The position of each dot reflects RNA fluorescence (x-axis) and the overall expression level of the plasmid indicated by the far-red fluorescence of eqFP670 (y-axis). E. coli expressing either Spinach (green) or no aptamer (gray) were used as controls. As can be seen, a fraction of the library-expressing bacteria exhibit fluorescence comparable to that seen in Spinach-expressing E. coli. (c) Screening of aptamer-expressing E. coli on DFHBI-agar plates. FACS isolated cells were plated on LB-agar plates. The next day resulted colonies were induced with IPTG and the dishes were treated with DFHBI to a final concentration of 1 mM and 40 μM, respectively. The plates were imaged using a BioRad ChemiDoc MP imager 4 h later. Fluorescence of the RNA–DFHBI complexes in the colonies was detected using ex = 470 ± 30 nm, em = 532 ± 28 nm. The expression of eqFP670 was detected using ex = 630 ± 30 nm, em = 697 ± 55 nm. The resulting images were processed in Fiji to normalize green fluorescence to the far-red fluorescence to control for variations in colony size and expression level. A heat map representation of the normalized image facilitates identification of the most promising mutants (numbered). (d) Identification of colonies with highest normalized fluorescence. Shown are the colonies from panel c that exhibited the highest fluorescence after normalization for eqFP670 expression. The signal from cells transformed with the empty vector was used to define the background and was subtracted in order to define aptamer-specific fluorescence. Clone 29-1 was chosen for further optimization on the basis of its marginally higher brightness in bacteria. Error bars indicate standard deviations (n = 3).
Figure 2
Figure 2
Truncation analysis of 29-1 identifies core domain responsible for fluorescence activation. The mFold-predicted secondary structure of 29-1 is presented. The borders of three truncations (T1, T2, T3, and T4) are indicated. Only T1 and T2 were able to induce fluorescence of DFHBI-1T (indicated with a green circle compared to a black, i.e., nonfluorescent circle) as measured under excess RNA conditions.
Figure 3
Figure 3
Additional round of directed evolution rescues diminished fluorescence of 29-1-T2. (a) Schematic representation of the fluorescent RNA aptamers directed evolution approach. (b) FACS dot plot of 29-1-T2 doped library in bacteria. Bacterial cells expressing this library or positive and negative control were preincubated with 40 μM DFHBI-1T and then FACS sorted. Negative bacterial population is dark gray (behind yellow), doped library expressing bacteria is yellow, and 29-1-expressing cells, used as a positive control, are dark green. Again, bacterial cells having the brightest fluorescent signal were isolated on the basis of the gate presented. This time dot plot is presented as green fluorescence vs side scatter, the latter was also used to exclude those negative cells which are bright owing to their increased size. (c) Bar graph of the normalized brightness of bacterial colonies of the winning clones in comparison with the original 29-1 and 29-1-T2. To assess sorted mutants’ performance in vivo, we expressed them in bacterial cells and measured fluorescent signal of bacterial colonies growing on agar dish supplemented with 40 μM DFHBI-1T. The signal from the empty-vector transformed cells was used as a background and subtracted. These data demonstrate successful restoration of the truncated aptamers’ brightness as evidenced by very similar signal of 29-1-3 compared to 29-1. Error bars indicated standard deviations (n = 3). (d) Alignment of the sequences of the brightest mutants from the doped 29-1-T2 library screening. The proposed mutation-tolerant (variable) and mutation-intolerant (conserved) regions are highlighted. Parent is the sequence that was subjected to doping. Green indicates conservative bases (or equivalent substitutions) participating in base pairing. Blue indicates conservative bases in bulges. Yellow indicates highly variable terminal stem-loop with the stabilized tetraloops in bold. Non-colored bases are mutations which prevent otherwise conservative base pairing or which are substitutions in conservative bulges.
Figure 4
Figure 4
mFold prediction of the secondary structure of Broccoli (circled with green) fused to tRNA (red). For comparison purposes the color coding of nucleotides is the same as in Figure 3d. Green indicates conservative bases (or equivalent substitutions) participating in base pairing. Blue indicates conservative bases in bulges. Yellow in this structure indicates reengineered terminal stem-loop. The non-colored base is a mutation in a conservative bulge. Either a small-molecule aptamer or another Broccoli unit (without tRNA) can be inserted in place of the indicated stem-loop.
Figure 5
Figure 5
Designing dimeric Broccoli. (a) mFold prediction of the secondary structure of dimeric Broccoli (dBroccoli). For simplicity no tRNA scaffold is drawn. Green color indicates the individual Broccoli units, yellow denotes the connector stem. (b) Dimeric Broccoli (tdBroccoli) is almost twice as bright as Broccoli (tBroccoli). To compare the in vitro performance of tBroccoli and tdBroccoli we ran them on a urea-PAGE gel, washed the gel in water to remove urea, and then allowed the aptamers to fold in the gel. The gel was stained with DFHBI-1T to visualize the aptamers. Afterward, the gel was stained with SYBR Gold to quantify the RNA. (d) Quantification of the DFHBI-1T-stained band fluorescence shown in panel b demonstrates that tdBroccoli is ∼1.8 fold brighter than tBroccoli. Band fluorescence was normalized to the RNA amount and the molecular weight to account for the different sizes of tBroccoli and tdBrococoli.
Figure 6
Figure 6
In vitro comparison of Broccoli and Spinach2. (a) Excitation and emission spectra of tBroccoli. Spectra were measured using 20 μM RNA and 2 μM DFHBI-1T. (b) Absorbance spectra of DFHBI-1T alone and in complex with tBroccoli show a red-shift similar to that previously observed for Spinach-DFHBI; here, 50 μM RNA was preincubated with 5 μM fluorophore, and the spectrum was compared to that of the fluorophore alone. (c) Dissociation constant of tBroccoli. To calculate the dissociation constant we performed a titration of 50 nM RNA with increasing concentration of DFHBI-1T and then fitted the resulting data points using the Hill equation as described previously., Error bars indicate standard deviations (n = 3). (d) Folding of tBroccoli and Broccoli in the context of different flanking sequences. tSpinach and tSpinach2 data were taken from ref (11). (e) Magnesium dependence of tBroccoli and tSpinach2. To measure magnesium dependence, 1 μM RNA was mixed with 10 μM DFHBI-1T and the fluorescence signal of the complex was measured at different concentrations of MgCl2. The signal at 1 mM MgCl2 for both aptamers was set to 100. Error bars indicated standard deviations (n = 3). (f) tBroccoli demonstrates higher thermostability compared to tSpinach2. To measure temperature dependence of tBroccoli and tSpinach2 fluorescence we followed fluorescent signal decay of 1 μM RNA and 10 μM fluorophore upon gradually increasing temperature.
Figure 7
Figure 7
tBroccoli and tdBroccoli show substantially improved performance in bacteria compared to tSpinach2. (a) Microphotographs of bacteria expressing tSpinach2, tBroccoli, and tdBroccoli. Respective aptamers were expressed in E. coli and then bacterial cells were attached to poly d-lysine coated glass-bottom dishes, preincubated with 200 μM DFHBI-1T and imaged under the fluorescent microscope. In these experiments, imaging was performed for 100 ms and the brightness of the images was adjusted on the basis of the high fluorescence signal of tdBroccoli, which results in lower signals for the other aptamers. Cells were imaged in PBS, which lacks magnesium. Here and in other panels, “Negative control” is the empty vector-transformed cells. Scale bar, 2 μm. (b) Quantification of fluorescence signal from bacterial cells in panel a, as measured in suspension on a plate reader. Error bars indicate standard deviations (n = 3). (c) tBroccoli, tSpinach2, and tdBroccoli are expressed at similar levels in bacterial cells. Total RNA from the cells from panels a and b was fractionated on urea-PAGE and stained with DFHBI-1T and SYBR Gold. tBroccoli, tSpinach2 and tdBroccoli RNA bands are indicated with yellow arrows. Higher molecular weight bands are unprocessed transcripts. 5S indicated with the black arrow was used as a loading normalization control. (d) Quantification of the intensity of the SYBR Gold-stained bands from the panel c. Sum of both processed and unprocessed RNA band intensity was normalized to aptamer length. Gel image processing was performed in Image Lab 5.0 software (BioRad). Error bars indicate standard deviations (n = 3).
Figure 8
Figure 8
Broccoli and dBroccoli are enhanced tRNA-independent tags for mammalian cell imaging. (a) Flow cytometry analysis of DFHBI-1T-treated HEK293T cells transfected with plasmids expressing 5S fused to aptamers in the tRNA scaffold. Untagged 5S was used as a negative control. mCherry expressed from another plasmid was used for assessing transfection efficiency. Transfected cells were analyzed in two channels: green (ex = 488 nm, em = 525 ± 50 nm) and red (ex = 561 nm, em = 610 ± 20). Where indicated, cells were also pretreated with 5 mM MgSO4. tSpinach2-induced fluorescence can only be observed upon magnesium treatment. (b) Fluorescent microscopy microphotographs of the cells from panel a. Cells were pretreated with 20 μM DFHBI-1T, 5 μg/mL Hoechst 33258, and 0.3 M sucrose and, where indicated, with 5 mM MgSO4. Exposure times are 0.5 s for the green fluorescence and 200 ms for mCherry and Hoechst. Scale bar, 10 μm. (c) Total RNA from the same transfected HEK293T cells was run on a urea-PAGE gel and stained with DFHBI-1T to reveal the aptamers. Gels were then subsequently stained with SYBR Gold to stain all RNA and allow RNA quantification. The same gel also shows total RNA from HEK293T cells expressing 5S fused to the aptamers without a tRNA scaffold. Endogenous 5S is used as a loading control. (d) Flow cytometry analysis of DFHBI-1T-treated HEK293T cells transfected with the plasmids expressing 5S fused to the aptamers without tRNA scaffold. Again, mCherry expression was used for transfection efficiency normalization and cells were analyzed in two channels: green (ex = 488 nm, em = 525 ± 50 nm) and red (ex = 561 nm, em = 610 ± 20). 5S-Spinach2 expressing cells were also tested in the presence of 5 mM MgSO4. No Spinach2 fluorescence is observed without a tRNA scaffold. (e) Fluorescent microscopy images of HEK293T cells expressing 5S-Broccoli or 5S-dBroccoli. Cells were pretreated with 20 μM DFHBI-1T and 0.3 M sucrose. Exposure time is 0.5 s. Scale bar, 10 μm.

References

    1. Tyagi S. Nat. Methods 2009, 6, 331. - PubMed
    1. Bertrand E.; Chartrand P.; Schaefer M.; Shenoy S. M.; Singer R. H.; Long R. M. Mol. Cell 1998, 2, 437. - PubMed
    1. Rackham O.; Brown C. M. EMBO J. 2004, 23, 3346. - PMC - PubMed
    1. Babendure J. R.; Adams S. R.; Tsien R. Y. J. Am. Chem. Soc. 2003, 125, 14716. - PubMed
    1. Constantin T. P.; Silva G. L.; Robertson K. L.; Hamilton T. P.; Fague K.; Waggoner A. S.; Armitage B. A. Org. Lett. 2008, 10, 1561. - PubMed

Publication types