. 2014 Dec 11;516(7530):213-8.
doi: 10.1038/nature13913. Epub 2014 Oct 22.

Structure and insights into the function of a Ca(2+)-activated Cl(-) channel

Affiliations

Structure and insights into the function of a Ca(2+)-activated Cl(-) channel

Veronica Kane Dickson et al. Nature. .

Abstract

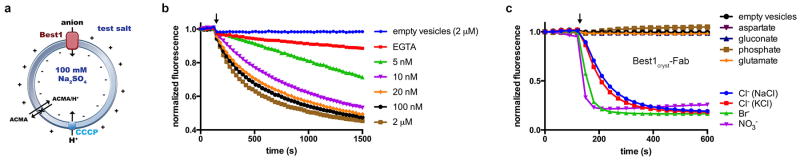
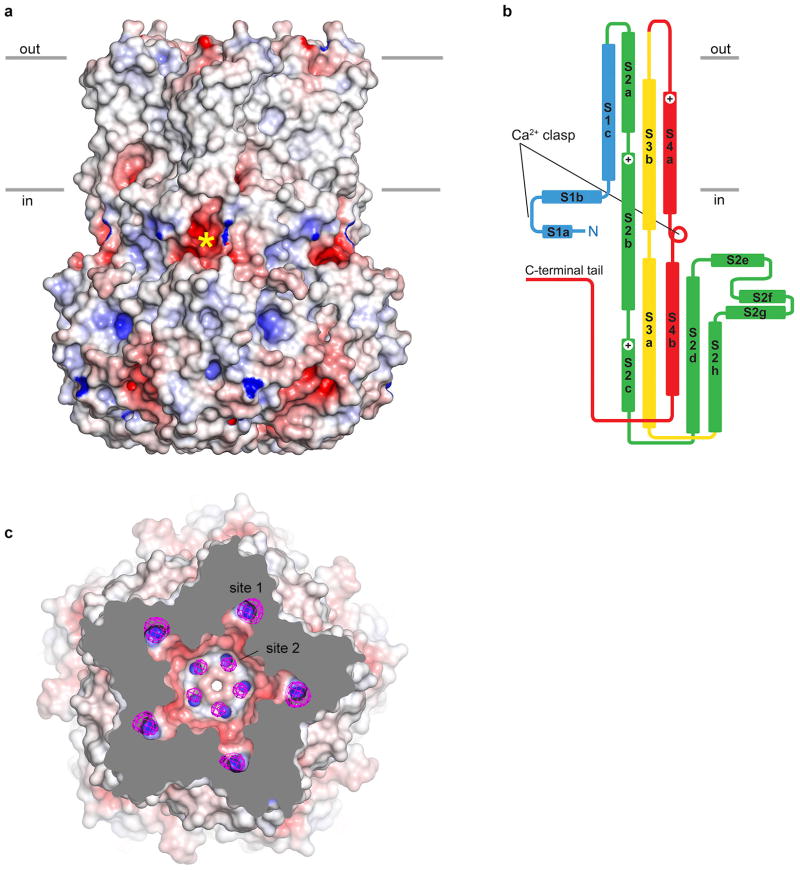
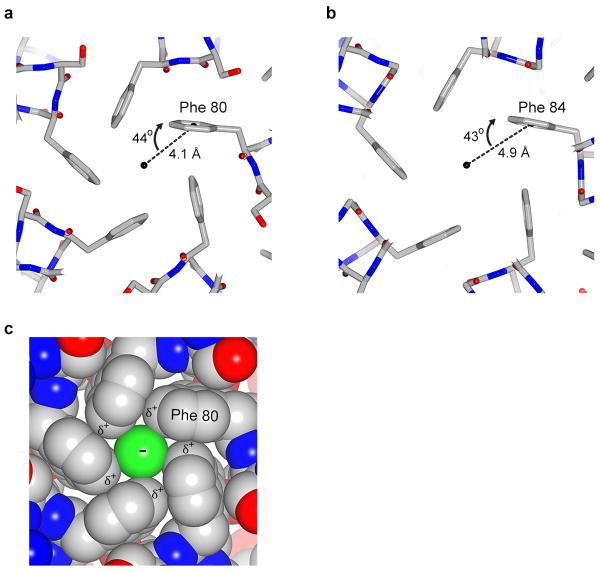
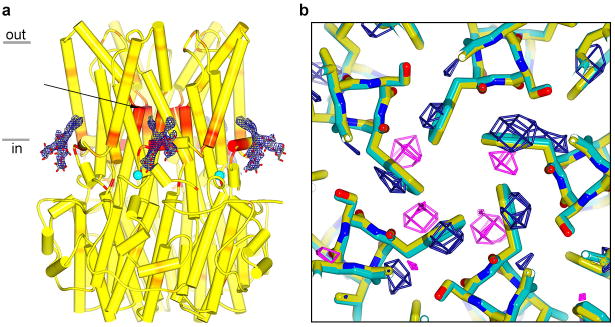
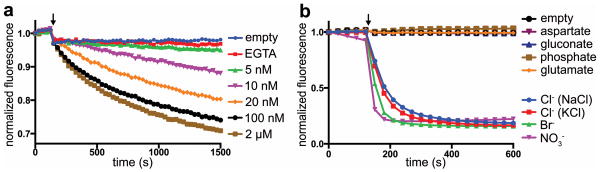
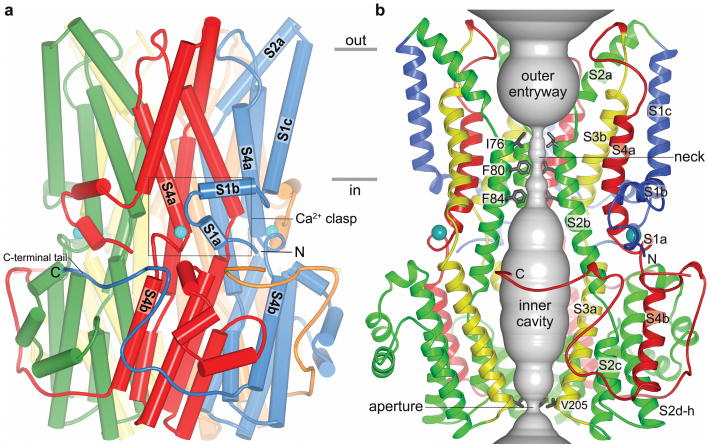
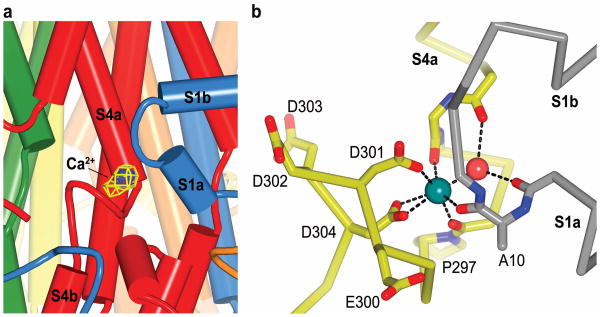
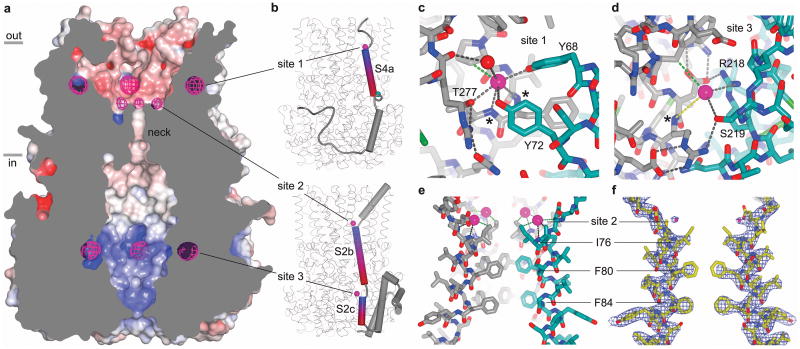
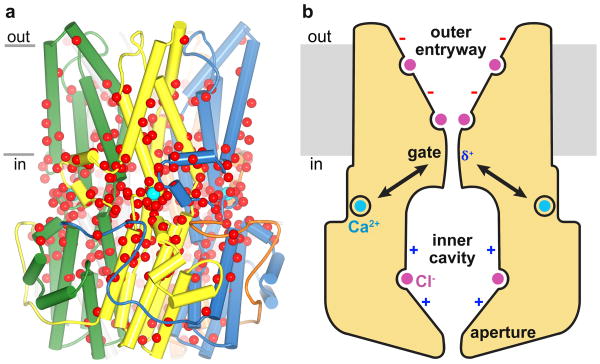
Bestrophin calcium-activated chloride channels (CaCCs) regulate the flow of chloride and other monovalent anions across cellular membranes in response to intracellular calcium (Ca(2+)) levels. Mutations in bestrophin 1 (BEST1) cause certain eye diseases. Here we present X-ray structures of chicken BEST1-Fab complexes, at 2.85 Å resolution, with permeant anions and Ca(2+). Representing, to our knowledge, the first structure of a CaCC, the eukaryotic BEST1 channel, which recapitulates CaCC function in liposomes, is formed from a pentameric assembly of subunits. Ca(2+) binds to the channel's large cytosolic region. A single ion pore, approximately 95 Å in length, is located along the central axis and contains at least 15 binding sites for anions. A hydrophobic neck within the pore probably forms the gate. Phenylalanine residues within it may coordinate permeating anions via anion-π interactions. Conformational changes observed near the 'Ca(2+) clasp' hint at the mechanism of Ca(2+)-dependent gating. Disease-causing mutations are prevalent within the gating apparatus.


Conflict of interest statement

Competing interests. The authors declare no competing interests.

Figures

Extended Data Figure 1
Extended Data Figure 1. Sequence alignment and secondary structure
The amino acid sequences of the crystallized chicken (Gallus gallus) Best1 construct (amino acids 2-405) and human Best1 are aligned and coloured according to the ClustalW convention. The secondary structure is indicated with cylinders representing α-helices, solid lines representing structured loop regions, and dashed lines representing disordered regions. Gray bars (labeled “in” and “out”) indicate approximate boundaries of transmembrane regions.
Extended Data Figure 2
Extended Data Figure 2. Fab binding to Best1cryst in the presence and absence of Ca2+
The binding of the Fab to Best1cryst was assayed by determining the amount of free Fab as a function of the concentration of Best1cryst in the presence of either 10 μM Ca2+ or 5 mM EGTA (zero Ca2+) (Methods). The fraction of Fab bound is plotted with respect to the concentration of Best1cryst. The curves correspond to fits of: fraction of Fab bound = [Best1]h/(Kdh + [Best1]h), where Kd is the equilibrium dissociation constant, h is the Hill coefficient, and [Best1] is the Best1cryst concentration. Derived parameters are: Kd = 15 nM in the presence of Ca2+ (h=1.3) and Kd = 350 nM in the absence of Ca2+ (h=1.3).
Extended Data Figure 3
Extended Data Figure 3. Electron density and the C-terminal tail
a, 2Fo-Fc electron density is shown, in stereo, for an area surrounding one of the five identical Ca2+ binding sites. The density was calculated from 40 to 2.85 Å resolution and contoured at 1.5 σ (blue mesh) and 7 σ (orange mesh) in the context of the final atomic model, which is shown as sticks and spheres (cyan sphere, calcium; red sphere, water). b, Electron density for the C-terminal tail. 2Fo-Fc electron density (blue mesh, calculated from 40 to 2.85 Å, and contoured at 1.5 σ) is shown for the C-terminal tail of the yellow coloured subunit. c, Expanded view highlighting the electron density near Ser 358. Consistent with the electron density, mass spectrometry analysis of tryptic peptides of purified Best1cryst detected only peptides containing Ser 358 that were not phosphorylated (Supplementary Discussion).
Extended Data Figure 4
Extended Data Figure 4. Overall structures of the Best1cryst-Fab complex
a, Structure of the Best1cryst-Fab complex in the P21 crystal form, viewed from the extracellular side. Fab molecules are grey and Best1 subunits are coloured individually with α-helices depicted as cylinders. b, Orthogonal view showing approximate boundaries of the membrane. For clarity, two Fabs are drawn. c, C2 crystal form. Overall structures of the two Best1cryst-Fab complexes in the asymmetric unit of the C2 crystal form are depicted in cartoon representation. Best1 subunits are colored individually and Fabs are gray.
Extended Data Figure 5
Extended Data Figure 5. Ca2+-dependent activation of Best1cryst and permeability of the Best1cryst-Fab complex
a, Schematic of the fluorescence-based flux assay. Vesicles diluted into various test salts establish ion gradients. Anion influx through Best1 produces a negative electric potential within the liposomes that drives the uptake of protons through an ionophore (CCCP) and quenches the fluorescence of a pH indicator (ACMA). b, Ca2+-dependent activation of Best1cryst using NO3- as the permeant anion. The experimental setup was identical to that for Fig. 1a, except that NO3- was used as the permeantion. Data presented here and in Fig. 1a were collected on the same day using the same batch of proteoliposomes and indicate the higher permeability of NO3- relative to Cl-. Free concentrations of Ca2+ are indicated. c, Ionic permeability of the Best1cryst-Fab complex. The experiment setup is identical to that shown (Fig. 1b), except that it was performed using proteoliposomes reconstituted with the Best1cryst-Fab complex. The Fab remained bound to the channel following reconstitution and excess Fab was maintained throughout (Methods). The slight differences in the shape of the curves for the Best1cryst and Best1cryst-Fab samples (e.g. the lower rate of fluorescence decrease for Cl compared with Fig. 1b) are in accord with variability observed among different liposome preparations.
Extended Data Figure 6
Extended Data Figure 6. Molecular surface, subunit topology, and anion binding in the outer entryway
a, The molecular surface of the channel is shown in the same orientation as Fig. 2a and coloured according to electrostatic potential (red: -10 kT e-1, gray: neutral, blue: +10 kT e-1). An asterisk marks the location of the acidic cluster in the foreground. Approximate boundaries for the membrane are indicated. b, Subunit topology. N-terminal ends of α-helices exposed to the pore are indicated by +. The coloring corresponds to that of Fig. 2b. c, Anion binding in the outer entryway. Extracellular cut-away view of the molecular surface of Best1 (orthogonal representation of Fig. 4a), revealing the surface of the pore (coloured by electrostatic potential; red: -10 kT e-1, white: neutral, blue: +10 kT e-1) and anomalous difference electron density for Br- ions (magenta mesh; 45 - 5 Å, non-crystallographic symmetry averaged, 8σ contour) in sites 1 and 2.
Extended Data Figure 7
Extended Data Figure 7. Geometry within the neck and the possibility of anion-π interactions
a-b, Representations of the pore at Phe 80 (a) and Phe 84 (b) are shown as sticks. The distance (d) from the central axis of the pore (black sphere) to the center of the face of the aromatic ring is shown. An angle θ is defined as the angle between this distance vector and the plane of the ring. The geometry indicated corresponds to the crystal obtained in cymal-6. For the cymal-6-NG crystal, the values are: d = 3.9 Å, θ = 45° (Phe 80) and d = 4.8 Å, θ = 44° (Phe 84). c, Space filling CPK representation of the pore at Phe 80, showing a hypothetical Cl- (green) positioned in the center. Standard radii were used for the figure (carbon = 1.7 Å, Cl- = 1.81 Å). δ+ and − represent partial charges on the edge of the aromatic rings and the charge on Cl-, respectively.
Extended Data Figure 8
Extended Data Figure 8. Evidence for coupling between the Ca2+ clasp and the gate from crystals grown in different detergents
Comparison among crystals grown using different detergents gives insight into the channel's gate and it's coupling to Ca2+. Well-diffracting crystals belonging to the P21 space group were obtained using either the detergent cymal-6 or the detergent cymal-6-NG. Electron density maps indicated the presence of ordered cymal-6-NG but not cymal-6 molecules bound to the S1a-S1b components of the Ca2+ clasps (a). In addition, difference Fourier electron density maps suggested a slight widening of the neck of the pore in the structure with cymal-6 (b). Accordingly, while refined structures superimpose with an overall root mean squared deviation of only 0.15 Å, the diameter of the pore in the hydrophobic neck is ∼ 0.5 Å wider at Phe 80 for crystals in cymal-6 than it is with cymal-6-NG. Differences on the order of 0.3 Å between the atomic models are localized to the region near the Ca2+ clasp and to the neck of the pore (a). The subtle effects are an indication that changes in or around the Ca2+ clasp induce changes in the neck of the pore and they may hint at the mechanism of gating. a, 2FO-FC electron density for cymal-6-NG detergent molecules, contoured at 1.2σ, is shown as blue mesh in the context of the channel. The channel, with α-helices depicted as cylinders, is coloured on a yellow-to-red spectrum according to the displacement of Cα atoms between the refined atomic models obtained from crystals grown in cymal-6 and cymal-6-NG. Yellow colour represents displacements less than 0.15 Å and red colour represents displacements greater than 0.3 Å. An arrow indicates the neck of the pore and teal spheres denote Ca2+. b, Conformational shift in the gate. Phe 80 and surrounding residues of the refined structures from crystals in cymal-6 and cymal-6-NG are shown as sticks (coloured cyan and yellow, respectively) and viewed along the channel's axis of symmetry from the extracellular side. Superimposed on this is an Fcymal-6-Fcymal-6-NG difference Fourier map, which is calculated from 25 Å to 3.5 Å resolution and contoured at -3.8σ (magenta mesh) and +3.8σ (blue mesh).
Figure 1
Figure 1. Ionic permeability of Best1 in liposomes
a, Purified Best1cryst recapitulates Ca2+-activated Cl- flux. Fluorescence traces elicited by various concentrations of free Ca2+ are shown. b, Anion permeability. Except for KCl, all test ions were sodium salts. The increased rate of fluorescence decay compared to a suggests that channels are predominately oriented with their cytosolic side inside the proteoliposomes. Arrows indicate addition of a proton ionophore (Extended Data Fig. 5a).
Figure 2
Figure 2. Architecture and Ion Pore
a, Overall structure of Best1cryst. The perspective is from within the membrane, with subunits coloured individually, α-helices depicted as cylinders, and approximate boundaries of the membrane indicated. The boxed region highlights a Ca2+ clasp with bound Ca2+ (teal sphere). b, Ion pore. Within a ribbon representation of three subunits of Best1 (two in the foreground are removed) is a representation (grey colour) of the minimal radial distance from the center of the pore to the nearest van der Waals protein contact. Secondary structural elements are coloured according to their four segments (S1 blue, S2 green, S3 yellow, S4 and C-terminal tail red).
Figure 3
Figure 3. Ca2+ sensing apparatus
a, View of a Ca2+ clasp (same orientation as Fig. 2a), showing electron density for Ca2+: FO-FC density (blue mesh; simulated annealing omit, 40 - 2.85 Å, 8σ contour) and anomalous difference density (yellow mesh, 40 - 4.0 Å, 3σ contour). b, Coordination in the Ca2+ clasp. The acidic cluster and the backbone carbonyls that coordinate (dotted lines) the Ca2+ (teal sphere) are depicted as sticks on a Cα representation. Dotted lines also indicate hydrogen bonds between the water molecule (red sphere) and the protein (backbone carbonyls of Val 9 and Glu 292). Carbon atoms of one subunit are grey and those from another are yellow.
Figure 4
Figure 4. Anion binding
a, Cut-away view of Best1, revealing the surface of the pore (coloured by electrostatic potential; red: -10 kT e-1, white: neutral, blue: +10 kT e-1) and anomalous difference electron density for Br- ions (magenta mesh; 45 - 5 Å, non-crystallographic symmetry averaged, 8σ contour). b, Anion binding sites (magenta spheres) at the N-terminal ends of α-helices. Representations of the S4 and S2 segments of one subunit (upper and lower panels, respectively) are shown in the context of the entire channel. α-helices (cylinders) interacting with Cl-/Br- are coloured blue-to-red from their N- to their C-terminal ends. A teal sphere (upper panel) denotes Ca2+. c, d, and e. Coordination of Cl-in sites 1, 2 and 3. Interactions (distances < 4 Å) with Cl- (magenta spheres) are shown for polar (grey dashes) and hydrophobic (green dashes) contacts. Protein is depicted as sticks, with carbon atoms of one subunit coloured teal and those of other subunits grey. Hydrogen bonding networks (in sites 1 and 3) and an ordered water molecule (red sphere in site 1) are shown. In c and d, asterisks indicate main chain amide nitrogen atoms at the N-terminal ends of α-helices. A dashed yellow line (d) indicates the ∼ 5Å distance to the N-terminal end of helix S2c. In e, Cl- coordination outside the neck of the porein site 2 is shown in the context of four S2 segments (foreground segment removed for clarity). f, Electron density (2FO-FC, 40 – 2.85 Å, 2.0σ contour) for two S2 segments and their corresponding Cl- ions (magenta spheres) in the same orientation as e.
Figure 5
Figure 5. Retinopathies and the gating apparatus
a, Locations of missense mutations associated with retinal diseases mapped on the structure (red spheresindicate Cα positions). Teal spheres represent Ca2+. b, Hypothesized mechanisms of gating and selectivity. Intracellular Ca2+ binding is coupled to dilation of the gate (neck). Within the context of the otherwise negatively-charged outer entryway, binding sites for monovalent anions (magenta) increase their local concentration. Phenylalanine residues within the gate may contribute to selective anion permeation via anion-π interactions (δ+). Additional binding sites for anions are located in the predominately positive inner cavity.

References

    1. Hartzell C, Putzier I, Arreola J. Calcium-activated chloride channels. Annual review of physiology. 2005;67:719–758. - PubMed
    1. Caputo A, Caci E, Ferrera L, Pedemonte N, Barsanti C, Sondo E, Pfeffer U, Ravazzolo R, Zegarra-Moran O, Galietta LJV. TMEM16A, a membrane protein associated with calcium-dependent chloride channel activity. Science (New York, NY) 2008;322:590–594. - PubMed
    1. Schroeder BC, Cheng T, Jan YN, Jan LY. Expression cloning of TMEM16A as a calcium-activated chloride channel subunit. Cell. 2008;134:1019–1029. - PMC - PubMed
    1. Yang Y, Cho H, Koo J, Tak M, Cho Y, Shim W, Park S, Lee J, Lee B, Kim B, Raouf R, Shin Y, Oh U. TMEM16A confers receptor-activated calcium-dependent chloride conductance. Nature. 2008 - PubMed
    1. Sun H, Tsunenari T, Yau KW, Nathans J. The vitelliform macular dystrophy protein defines a new family of chloride channels. Proceedings of the National Academy of Sciences of the United States of America. 2002;99:4008–4013. - PMC - PubMed

Publication types

MeSH terms