. 2014 Dec 18;516(7531):428-31.
doi: 10.1038/nature13906. Epub 2014 Oct 22.

Rapid modelling of cooperating genetic events in cancer through somatic genome editing

Affiliations

Rapid modelling of cooperating genetic events in cancer through somatic genome editing

Francisco J Sánchez-Rivera et al. Nature. .

Abstract

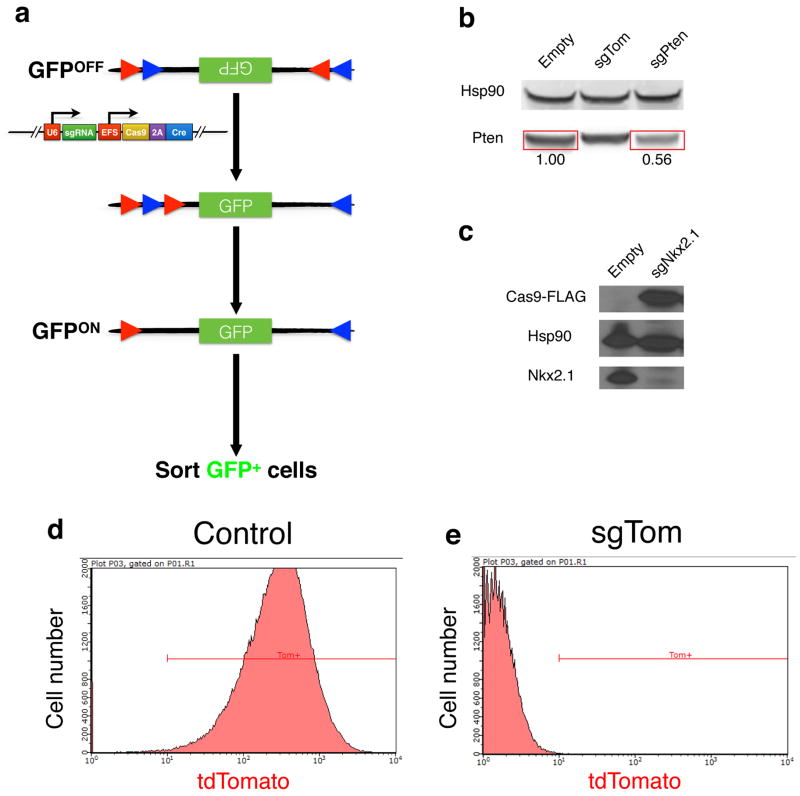
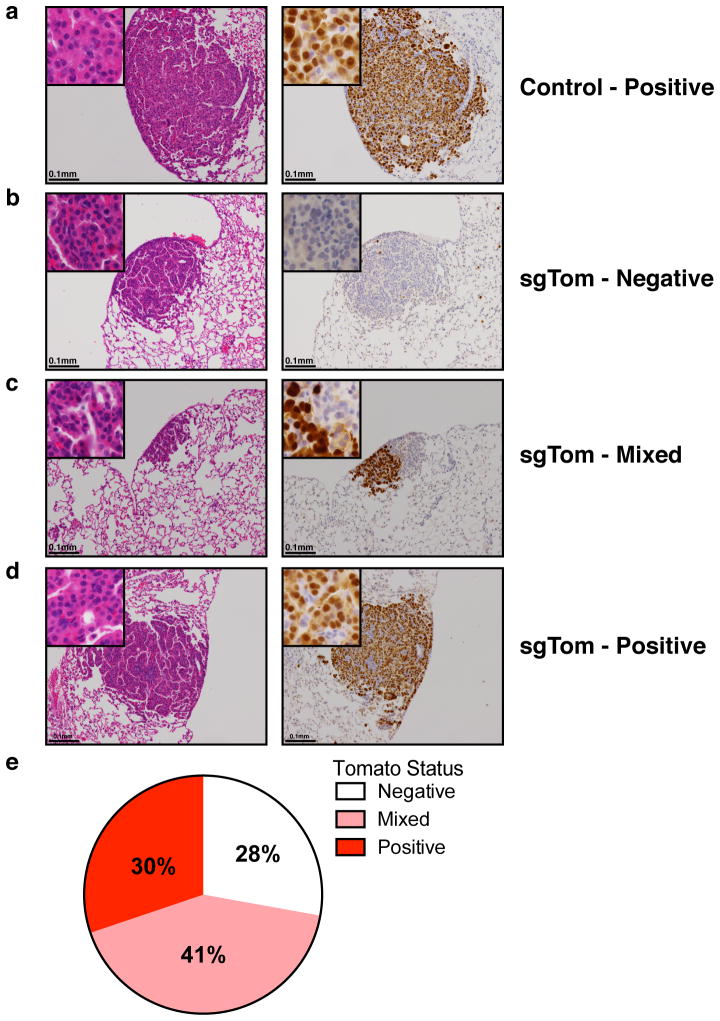
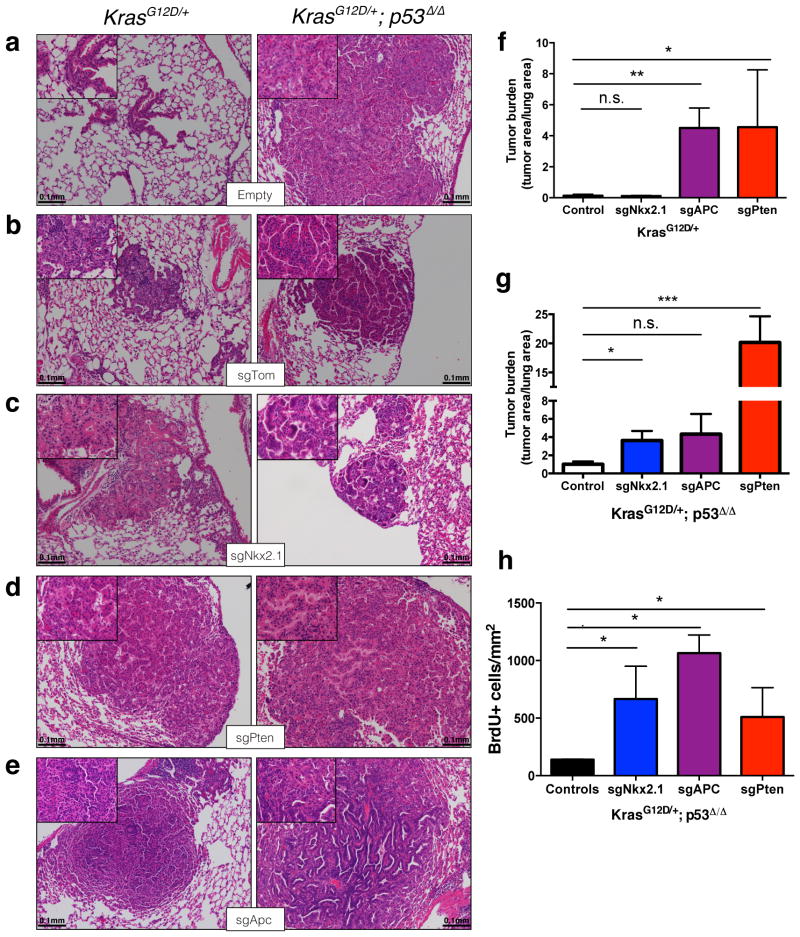
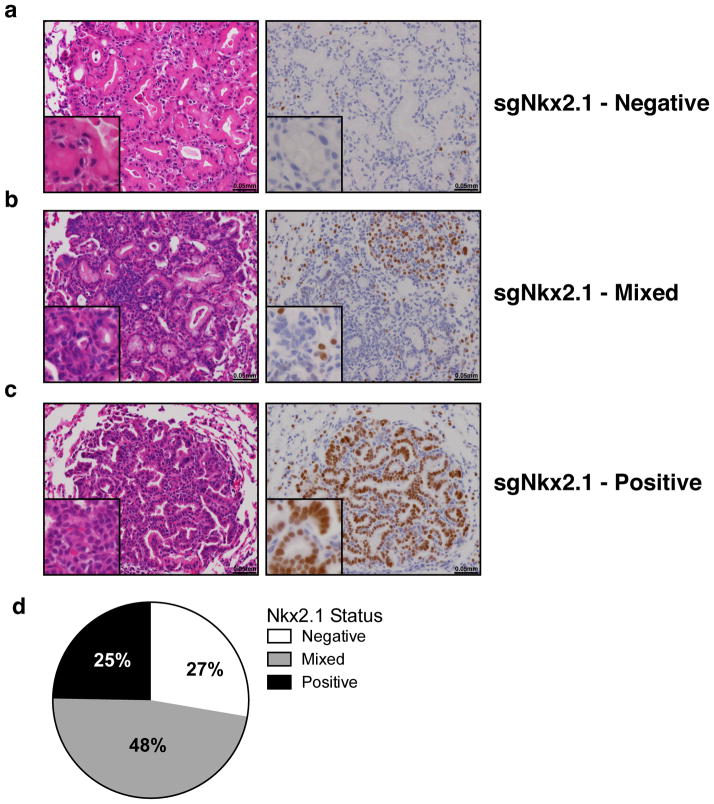
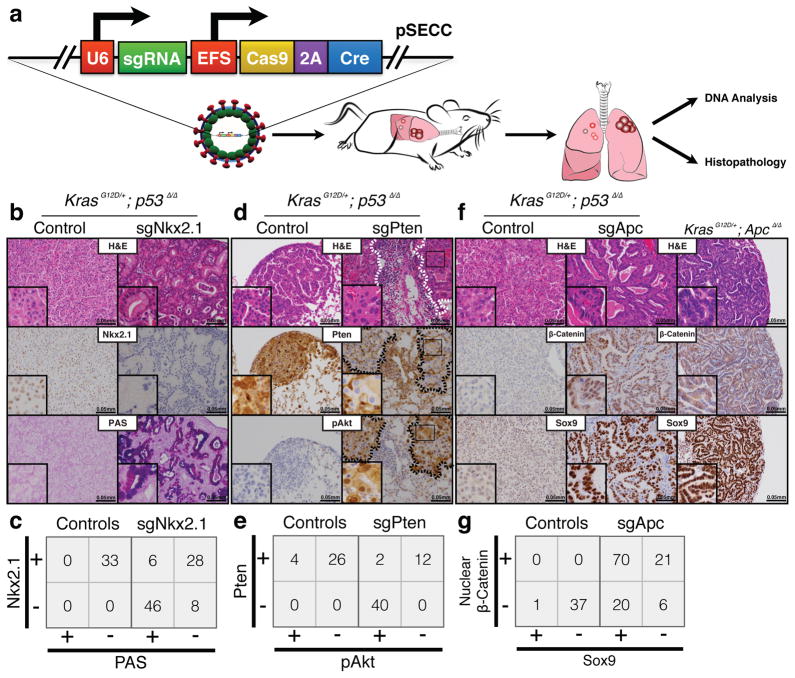
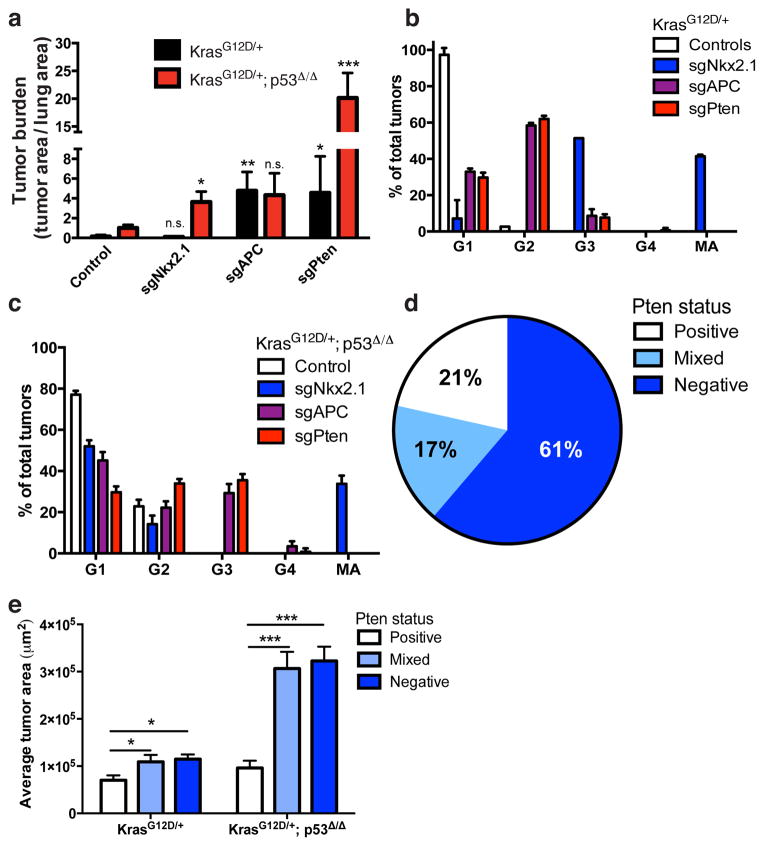
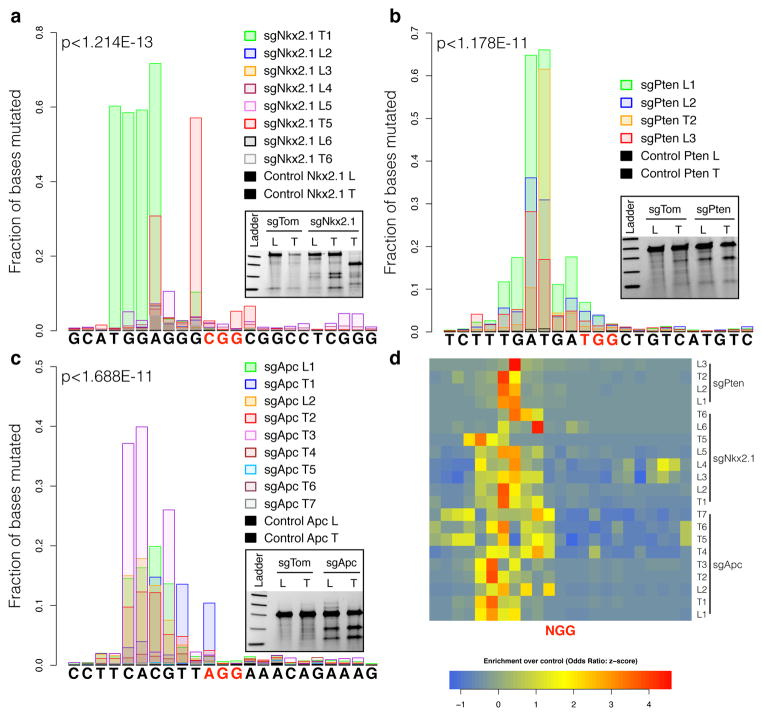
Cancer is a multistep process that involves mutations and other alterations in oncogenes and tumour suppressor genes. Genome sequencing studies have identified a large collection of genetic alterations that occur in human cancers. However, the determination of which mutations are causally related to tumorigenesis remains a major challenge. Here we describe a novel CRISPR/Cas9-based approach for rapid functional investigation of candidate genes in well-established autochthonous mouse models of cancer. Using a Kras(G12D)-driven lung cancer model, we performed functional characterization of a panel of tumour suppressor genes with known loss-of-function alterations in human lung cancer. Cre-dependent somatic activation of oncogenic Kras(G12D) combined with CRISPR/Cas9-mediated genome editing of tumour suppressor genes resulted in lung adenocarcinomas with distinct histopathological and molecular features. This rapid somatic genome engineering approach enables functional characterization of putative cancer genes in the lung and other tissues using autochthonous mouse models. We anticipate that this approach can be used to systematically dissect the complex catalogue of mutations identified in cancer genome sequencing studies.


Conflict of interest statement

The authors declare no competing financial interests.

Figures

Extended Data Figure 1
Extended Data Figure 1. In vitro validation of pSECC
(a) The Green-Go Cre-reporter cell line used to validate pSECC lentiviruses in vitro. Upon infection with a Cre-containing lentivirus, such as pSECC, cells become GFP+, allowing for purification of pSECC-containing cells by FACS. Red and blue triangles denote pairs of loxP sites, with red loxP sites being able to recombine only with other red loxP sites and blue loxP sites being able to recombine only with other blue loxP sites. (b) Validation of sgPten-pSECC. Numbers below the bands denote quantitation of protein level relative to empty vector control. (c) Validation of sgNkx2.1-pSECC in a cell line that expresses Nkx2.1. (d–e) Validation of sgTom-pSECC by Fluorescence Activated Cell Sorting (FACS). Briefly, a cell line obtained from a KrasLSL-G12D/+; p53flox/flox Rosa26LSL-tdTomato/LSL-tdTomato (KPT) mouse was infected with either Empty-pSECC (d) or sgTom-pSECC (e) and cultured for 10 days post-infection, after which the cells were harvested and analyzed by FACS.
Extended Data Figure 2
Extended Data Figure 2. In vivo validation of pSECC
(a) Representative H&E and tdTomato IHC staining of serial sections from lung tumors of KPT mice infected with Empty-pSECC. (b–d) Representative H&E and IHC staining of serial sections from (b) negative, (c) mixed and (d) positive lung tumors of KPT mice infected with sgTom-pSECC (n=6). (e) Distribution of lung tumors from all mice infected with sgTom-pSECC (n=6) that were scored as negative, mixed or positive based on tdTomato IHC.
Extended Data Figure 3
Extended Data Figure 3. Histological analysis of lung tumors obtained from mice infected with pSECC lentiviruses
(a) Empty-pSECC, (b)sgTom-pSECC, (c) sgNkx2.1-pSECC, (d) sgPten-pSECC and (e) sgApc-pSECC. (f–g) Quantitation of tumor burden (total tumor area/total lung area) in K (f) or KP (g) animals 10 weeks after infection with pSECC lentiviruses expressing: control (empty or sgTom, n=4 K and 7 KP), sgNkx2.1 (n=2 K and 6 KP), sgApc (n=3 K and 6 KP) and sgPten (n=4 K and 3 KP). (h) Quantitation of BrdU incorporation (BrdU+ cells/mm2) to assess proliferation of tumor cells from lung tumors in KP animals 10 weeks after infection with pSECC lentiviruses expressing: control (empty or sgTom, n=4 tumors), sgNkx2.1 (n=11 tumors), sgApc (n=10 tumors) and sgPten (n=15 tumors). Mice were given a pulse of BrdU for 4 hours before being sacrificed. Note: n.s. = not significant, * = p<0.05, ** = p<0.01, *** = p< 0.001 obtained from two-sided Student’s t-test. All error bars denote s.e.m.
Extended Data Figure 4
Extended Data Figure 4. IHC-based analysis of mice infected with sgNkx2.1-pSECC
(a) Negative, (b) mixed and (c) positive lung tumors of mice infected with sgNkx2.1-pSECC. (d) Distribution ofNkx2.1 IHC staining status in all sgNkx2.1-pSECC infected animals (n=8) represented as percent of negative, mixed and positive tumors. Positive tumor = ~100% of the tumor cells stained positive for Nkx2.1. Mixed tumor = at least ~30% of tumor cells stained positive for Nkx2.1. Negative tumor = <25% of the tumor cells stained positive for Nkx2.1.
Extended Data Figure 5
Extended Data Figure 5. IHC-based analysis mice infected with sgPten-pSECC
(a) Negative, (b) mixed and (c) positive lung tumors of mice infected with sgPten-pSECC (n=9). Positive tumor = ~100% of the tumor cells stained positive for Pten. Mixed tumor = at least ~30% of tumor cells stained positive for Pten. Negative tumor = <25% of the tumor cells stained positive for Pten. Note: dashed line in (b) demarcates positive/negative tumor area.
Extended Data Figure 6
Extended Data Figure 6. IHC-based analysis of K- and KP-sgApc tumors
(a) Representative H&E and IHC staining of serial sections from KP-sgTom (control), K-sgApc and KP-sgApc lung tumors. CCSP = Clara Cell Secretory Protein, SP-C = Surfactant Protein C. (b) Contingency table demonstrating a statistically significantly higher number of β-catenin/Sox9 double-positive tumors in KP-sgApc mice (29/33 tumors, 88%) vs K-sgApc mice (41/58 tumors, 71%) (one-sided Chi-square test, p<0.05). (c) Percentage of all tumors that stained positive for nuclear β-catenin that stained positive or negative for Sox9 in K- and KP-sgApc mice. (d) Contingency table demonstrating a statistically significantly higher number of tumors with Nkx2.1 Low/Negative areas (which are also SP-C Low/Negative) in sgApc-pSECC animals compared to sgTom-pSECC control animals (two-sided Fisher’s exact test, p<0.0001). (e) Representative IHC staining of serial sections from an Nkx2.1 Low/Neg lung tumor obtained from a KrasLSL-G12D/+; Apcflox/flox mouse 18 weeks after infection with Adeno-Cre. Inset shows Sox9 staining. Low/Neg = tumor that had areas with clear downregulation or complete loss of Nkx2.1 or SP-C as assessed by IHC staining.
Extended Data Figure 7
Extended Data Figure 7. Representative examples of indels observed in lungs and tumors from mice infected with pSECC lentiviruses
Representative indels observed in the (a)Nkx2.1, (b)Pten and (c)Apc locus from sgNkx2.1T1, sgPtenL1 and sgApcT3 samples, respectively. Left panel: details of sequence alignments around the PAM sequence. Right panel: overview of sequence alignments around the PAM sequence. Deletions and insertions are highlighted in black and purple bars, respectively. Inset in (a) depicts a magnification of an insertion. (d) Distribution of indels (in-frame insertions, frameshift insertions, in-frame deletions and frameshift deletions) observed in samples from mice infected with sgNkx2.1-pSECC, sgPten-pSECC and sgApc-pSECC. Amp: mutations across whole PCR amplicon, PAM: Mutations 7 base pairs upstream of PAM sequence (e) Table summarizing percentages of indels from total mutant reads (Left % = Amp/Right % = PAM). All error bars denote s.e.m.
Extended Data Figure 8
Extended Data Figure 8. Off-target analysis
Analysis of off-target editing for (a–c) sgNkx2.1, (d–f) sgPten and (g–i) sgApc. Briefly, potential off-target cutting at the top three predicted off-target sites (obtained from http://crispr.mit.edu/; see Supplementary Tables 2) for each sgRNA was assayed by Illumina MiSeq. Each plot corresponds to the fraction of bases mutated per position in 10bp flanks on either side of the PAM sequence (highlighted in red). Samples were obtained from entire lobes (L) from mice 10 weeks after infection with pSECC lentiviruses expressing sgNkx2.1, sgPten, sgApc or sgTom (control).
Figure 1
Figure 1. CRISPR/Cas9-mediated somatic gene editing in an autochthonous mouse model of lung cancer
(a)pSECC lentiviruses are intratracheally delivered into the lungs of mice to delete genes of interest. DNA extracted from tumor-bearing lungs is analyzed by high-throughput sequencing and surveyor assays to identify gene-editing events. The remaining tissue is analyzed by histopathology. (b) Representative H&E and IHC stainings of serial sections from lung tumors of mice 10 weeks after infection with sgTom-pSECC (left panel) or sgNkx2.1-pSECC (right panel). Alcian Blue/PAS (Periodic Acid-Schiff) stain for mucin. Note the accumulation of mucin only in tumors from sgNkx2.1-pSECC mice. (c) Contingency tables demonstrating anti-correlation between Nkx2.1 expression and mucin production (PAS stain) (two-sided Fisher’s exact test, p<0.0001). (d) Representative H&E and IHC stainings of serial sections from lung tumors of mice 10 weeks after infection with sgTom-pSECC (left panel) or sgPten-pSECC (right panel). Note: dashed lines demarcate tumor boundaries on each consecutive histological section. (e) Contingency tables demonstrating anti-correlation between Pten expression and Akt phosphorylation (two-sided Fisher’s exact test, p<0.0001). (f) Representative H&E and IHC stainings of serial sections from lung tumors of mice 10 weeks after infection with sgTom-pSECC (left panel) or sgApc-pSECC (middle panel). The far right panel corresponds to serial sections from lung tumors of KrasLSL-G12D/+; Apcflox/flox mice 18 weeks after infection with Adeno-Cre.(g) Contingency tables demonstrating positive correlation between β-Catenin expression and Sox9 expression (two-sided Fisher’s exact test, p<0.0001). These data are representative of at least 3 independent K or KP mice infected with each pSECC sgRNA.
Figure 2
Figure 2. Histopathological characterization of tumors from pSECC infected animals
(a) Combined quantitation of tumor burden (total tumor area/total lung area) in both K and KP animals 10 weeks after infection with pSECC lentiviruses expressing: control (empty or sgTom, n=4 K and 7 KP), sgNkx2.1 (n=2 K and 6 KP), sgApc (n=3 K and 6 KP) and sgPten (n=4 K and 3 KP). The asterisks indicate statistical significance obtained from comparing K-sgTarget samples to K-Control samples or KP-sgTarget samples to KP-Control samples using Student’s t-test (two-sided).(b-c) Distribution of tumor grades in K (b) or KP (c) animals 10 weeks after infection with pSECC lentiviruses expressing: control (empty or sgTom, n=4 K and 7 KP), sgNkx2.1 (n=2 K and 6 KP), sgApc (n=3 K and 6 KP) and sgPten (n=4 K and 3 KP). G1: grade 1, G2: grade 2, G3: grade 3, G4: grade 4, MA: mucinous adenocarcinoma. (d) Distribution of Pten IHC staining status in all sgPten-pSECC infected animals (n=9) represented as percent of negative, mixed and positive tumors. (e) Quantitation of average tumor area (μm2) of tumors staining negative, mixed or positive in all sgPten-pSECC infected animals (n=9). Positive tumor = ~100% of the tumor cells stained positive for Pten. Mixed tumor = at least ~30% of tumor cells stained positive for Pten. Negative tumor = <25% of the tumor cells stained positive for Pten. Note: n.s. = not significant, * = p<0.05, ** = p<0.01, *** = p< 0.001 obtained from two-sided Student’s t-test. All error bars denote s.e.m.
Figure 3
Figure 3. CRISPR/Cas9 efficiently generates indels in autochthonous tumors
(a–c) Fraction of bases mutated per position in 10bp flanks on either side of the Protospacer Adjacent Motif (PAM) sequence (highlighted in red). Samples were obtained from entire lobes (L) or microdissected tumors (T) from mice 10 weeks after infection with pSECC lentiviruses targeting (a)Nkx2.1, (b)Pten or (c)Apc. P-values denote enrichment of mutation rate in sgTarget-pSECC samples compared to sgTom-pSECC control samples (Wilcoxon rank sum test). Insets depict surveyor assays for each of the targets from either entire lobes (L) or microdissected tumors (T) from mice. Samples obtained from mice infected with sgTom-pSECC were used as controls. (d) Positional enrichment of mutations in sgTarget-pSECC samples compared to sgTom-pSECC control samples based on all mutations considered at a given position (SNPs, indels). Each row represents a different sgRNA Lung (L) or Tumor (T) sample. Each cell represents the row-normalized (z-score) odds ratio estimate of mutational enrichment over an associated control sample (Fisher’s exact test) upstream (+) or downstream (−) of the PAM sequence.

References

    1. Hanahan D, Weinberg RA. The hallmarks of cancer. Cell. 2000;100:57–70. - PubMed
    1. Imielinski M, et al. Mapping the hallmarks of lung adenocarcinoma with massively parallel sequencing. Cell. 2012;150:1107–1120. - PMC - PubMed
    1. Govindan R, et al. Genomic landscape of non-small cell lung cancer in smokers and never-smokers. Cell. 2012;150:1121–1134. - PMC - PubMed
    1. Network, T. C. G. A. R. Comprehensive molecular profiling of lung adenocarcinoma. Nature. 2014 - PMC - PubMed
    1. Jackson EL, et al. Analysis of lung tumor initiation and progression using conditional expression of oncogenic K-ras. Genes & development. 2001;15:3243–3248. - PMC - PubMed

Publication types

Substances

LinkOut - more resources