

Role of compartmentalization on HiF-1α degradation dynamics during changing oxygen conditions: a computational approach
- PMID: 25338163
- PMCID: PMC4206521
- DOI: 10.1371/journal.pone.0110495
Role of compartmentalization on HiF-1α degradation dynamics during changing oxygen conditions: a computational approach
Abstract
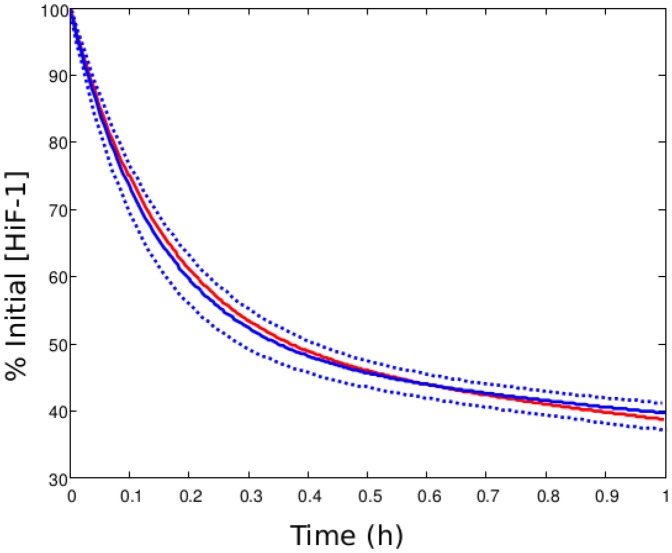
HiF-1α is the central protein driving the cellular response to hypoxia. Its accumulation in cancer cells is linked to the appearance of chemoresistant and aggressive tumor phenotypes. As a consequence, understanding the regulation of HiF-1α dynamics is a major issue to design new anti-cancer therapies. In this paper, we propose a model of the hypoxia pathway, involving HiF-1α and its inhibitor pVHL. Based on data from the literature, we made the hypothesis that the regulation of HiF-1α involves two compartments (nucleus and cytoplasm) and a constitutive shuttle of the pVHL protein between them. We first show that this model captures correctly the main features of HiF-1α dynamics, including the bi-exponential degradation profile in normoxia, the kinetics of induction in hypoxia, and the switch-like accumulation. Second, we simulated the effects of a hypoxia/reoxygenation event, and show that it generates a strong instability of HiF-1α. The protein concentration rapidly increases 3 hours after the reoxygenation, and exhibits an oscillating pattern. This effect vanishes if we do not consider compartmentalization of HiF-1α. This result can explain various counter-intuitive observations about the specific molecular and cellular response to the reoxygenation process. Third, we simulated the HiF-1α dynamics in the tumor case. We considered different types of mutations associated with tumorigenesis, and we compared their consequences on HiF-1α dynamics. Then, we tested different therapeutics strategies. We show that a therapeutic decrease of HiF-1α nuclear level is not always correlated with an attenuation of reoxygenation-induced instabilities. Thus, it appears that the design of anti-HiF-1α therapies have to take into account these two aspects to maximize their efficiency.
Conflict of interest statement
Figures


 ).
).  varies over a [1 100] range (A), and a [0.1 10] range (B).
 ) and of the pVHL/HiF-1α complex formation rate (
 ). To the left of the red dotted line, total HiF-1α significantly increases with respect to the default value. B. Ratio between nuclear and cytoplasmic HiF-1α levels as a function of
  and
and  . To the left of the red dotted line, HiF-1α accumulates in the nucleus.
 = 10, 5, 1.
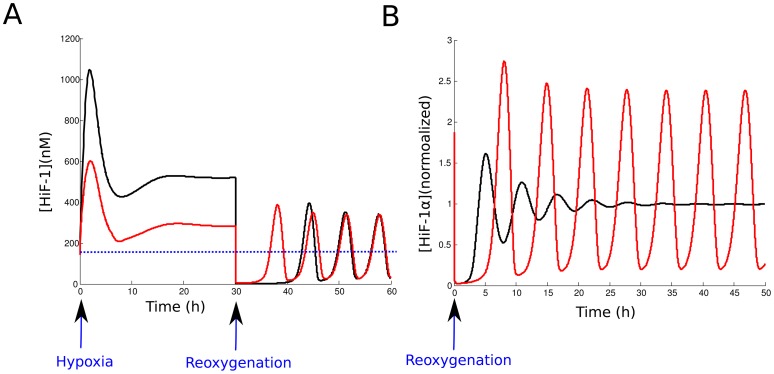
 = 10. Black:
  = 1. The dotted blue line corresponds to the HiF-1α concentration in normoxia. B. Response to reoxygenation in our compartmentalized model (red curve) and in a non-compartmentalized model of HiF-1α regulation (black curve). The nuclear HiF-1α was normalized to its value at normoxia
 mutated cells, compared to normal cells. The ratio [HiF-1α]
 /[HiF-1α]
 is plotted as a function of
  (HiF-1α synthesis rate) and
  (pVHL export rate). The black dotted square indicates the location of the peritoneal cancer studied by Yoshikawa et al. (2006) , characterized by a 2-fold increase of HiF-1α protein and a 3-fold increase of HiF-1α mRNA. B. Effects of reoxygenation on normal cells, and mutated cells. Reoxygenation after hypoxia is simulated, and the evolutions of nuclear HiF-1α concentration are plotted in the case of normal (
 = 1000, red curve), and
  mutated cells (
 = 5000, black curve). The dotted lines represents the normoxic equilibrium levels in each case.
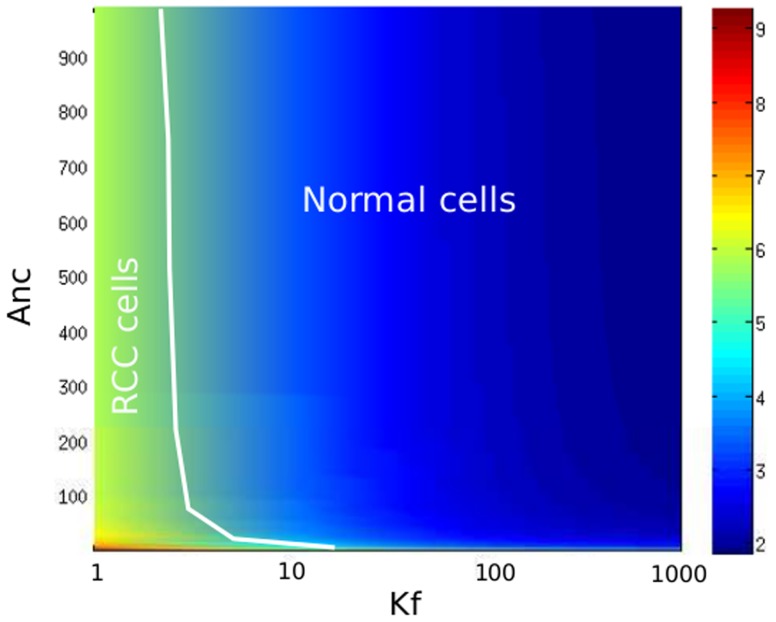
 /[HiF-1α]
 is plotted as a function of
  (pVHL/HiF-1α complex formation rate) and
  (pVHL export rate). The white line limits the space of the RCC cancer cells studied by Wiesener et al. (2001) .
 = ([HiF-1α]
 /[HiF-1α]
 ) (in the nucleus) as a function of
  (complexation rate) and
  (pVHL export rate). A. Without siRNA therapy (HiF-1α synthesis rate
  = 1000). B. With siRNA therapy (
 = 200).
 = 1000 (black curve) and
  = 200 (red curve). The blue dotted line represents the normoxic level for a normal cell.
 = [HiF-1α]
 /[HiF-1α]
 is plotted as a function of
  (pVHL export rate) and
  (HiF-1α synthesis rate). Left: non-treated cells. Right: result after a 10-fold increase of pVHL-dependent degradation of cytoplasmic and nuclear HiF-1α degradation rates (
 and
and  ).
).
 (red curve). The cell considered is a tumor cell, with a deregulation of HiF-1α expression (
 = 3000) The blue dotted line represents the normoxic level for this cell.
References
-
- Semenza GL (2007) Hypoxia-inducible factor 1 (hif-1) pathway. Sci STKE 2007: cm8. - PubMed
-
- Kooner P, Maini PK, Gavaghan DJ (2006) Mathematical modelling of the hif-1 mediated hypoxic response in tumours. Proceedings of the 2005 International Symposium on Mathematical & Computational Biology BIOMAT 2005: 281–315.
-
- Semenza GL (2003) Targeting hif-1 for cancer therapy. Nat Rev Cancer 3: 721–732. - PubMed
-
- Maxwell PH, Wiesener MS, Chang GW, Clifford SC, Vaux EC, et al. (1999) The tumour suppressor protein vhl targets hypoxia-inducible factors for oxygen-dependent proteolysis. Nature 399: 271–275. - PubMed
-
- Gardner LB, Li Q, Park MS, Flanagan WM, Semenza GL, et al. (2001) Hypoxia inhibits g1/s transition through regulation of p27 expression. J Biol Chem 276: 7919–7926. - PubMed
MeSH terms
Substances
LinkOut - more resources
Full Text Sources
Other Literature Sources
Research Materials
