. 2015 Jan;88(1):6-20.
doi: 10.1002/cyto.b.21196. Epub 2014 Oct 23.

Dextramer reagents are effective tools for quantifying CMV antigen-specific T cells from peripheral blood samples

Affiliations

Dextramer reagents are effective tools for quantifying CMV antigen-specific T cells from peripheral blood samples

Joseph D Tario Jr et al. Cytometry B Clin Cytom. 2015 Jan.

Abstract

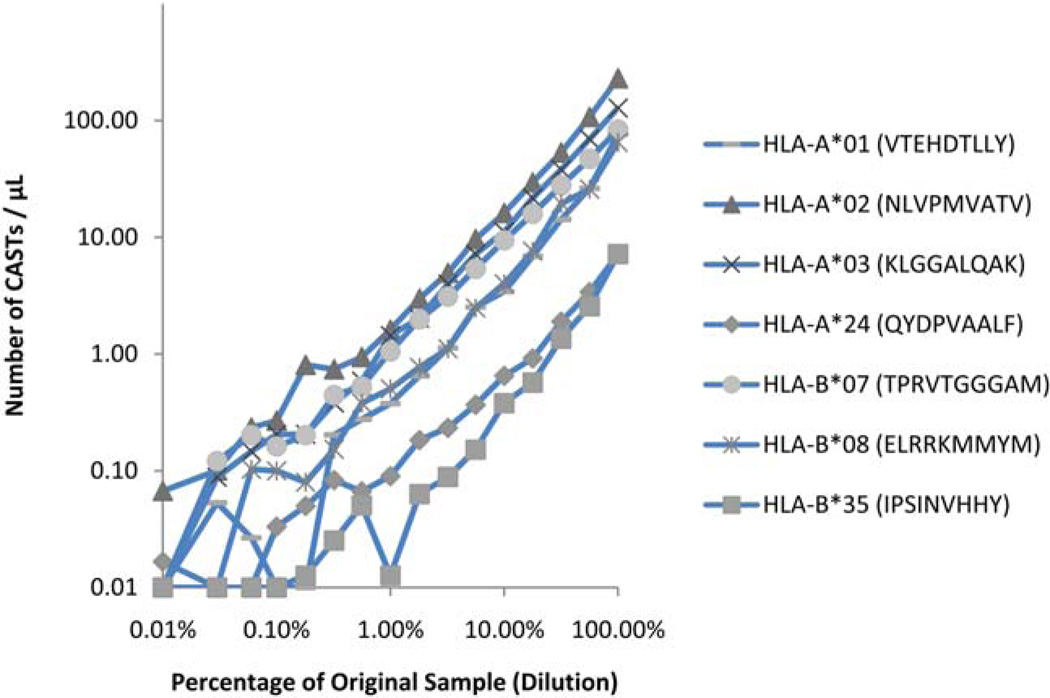
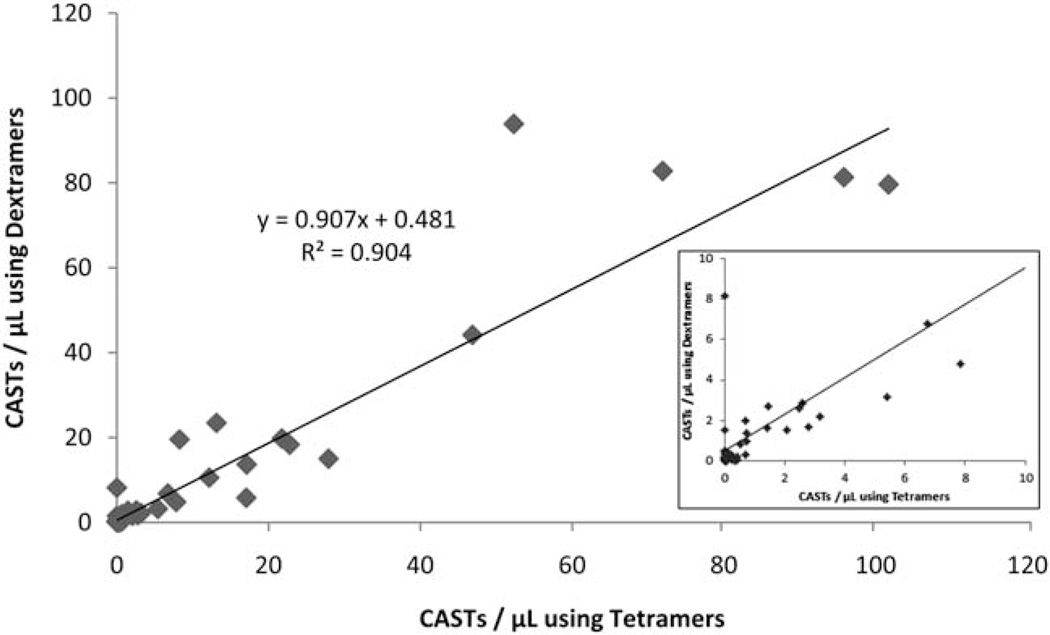
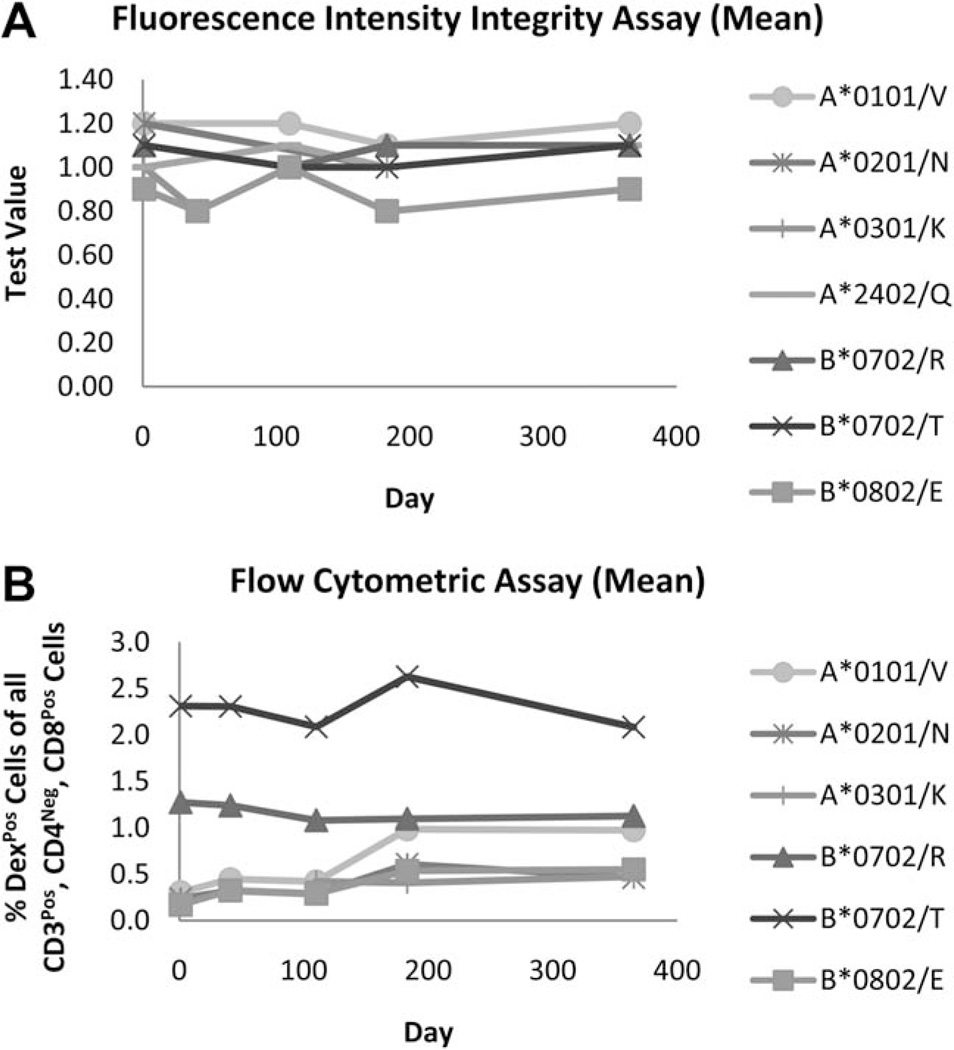
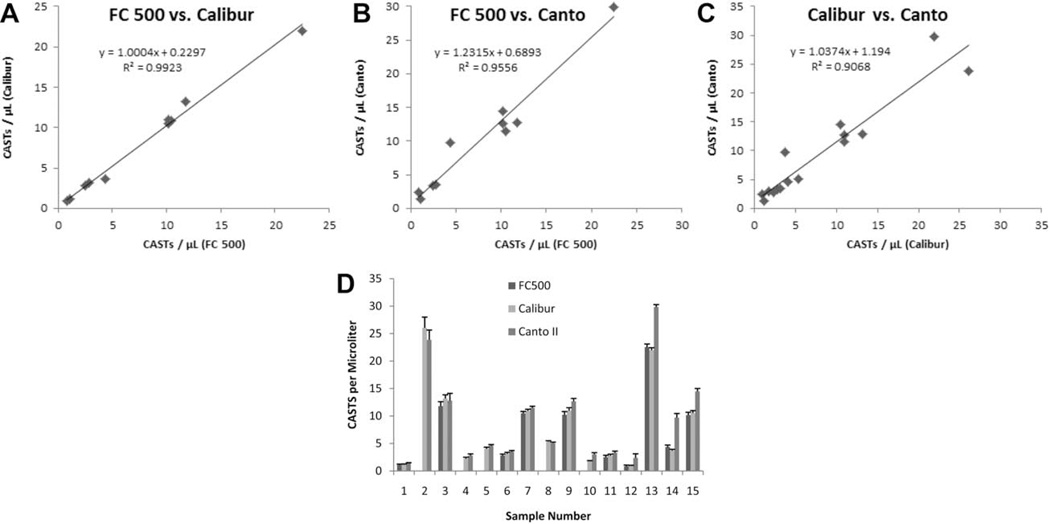
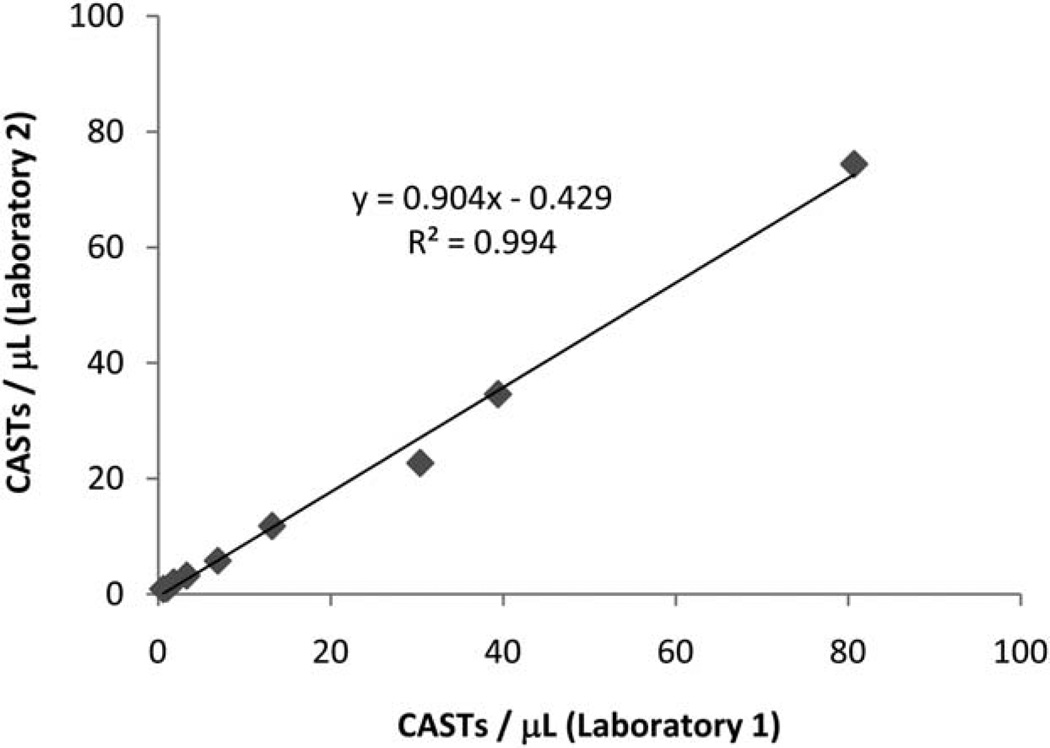
The enumeration of antigen-specific T cells is increasingly relevant in clinical and research settings. This information is useful for evaluating immune responses to treatment, monitoring the efficacy of anticancer vaccines, and for detecting self-reactive T cells in autoimmune disorders. Quantifying antigen-specific T cells can be accomplished via IFNγ ELISpot assay, the measurement of intracellular cytokine production by flow cytometry, or by lymphocyte proliferation assays in response to antigen. While robust, these technologies are labor-intensive and can take several days to obtain results. New technology has led to more powerful tools for quickly and accurately measuring antigen-specific T cells by flow cytometry via fluorescently-labeled TCR-specific multimers. In this study, we evaluated the use of an assay based on Dextramer reagents for enumerating cytomegalovirus (CMV) antigen-specific T cells (CASTs). Assay performance characteristics were assessed by establishing Dextramers' sensitivity (median=0.4; range=0.1-1.4 CASTs μl(-1) ), determining their specificity (100%), evaluating assay robustness with different leukocyte sources and assay reproducibility via interlaboratory and interinstrument investigations. Furthermore, the levels of CASTs in 95 peripheral blood samples from 62 unique blood and marrow transplants recipients correlated well between Dextramers and Tetramers (R(2) =0.9042).

Keywords: Dextramers; antigen-specific T-cell; cytomegalovirus; flow cytometry; immune monitoring.


Figures

Fig. 1
Fig. 1
Gating strategies for measuring the absolute number of CD3+/ CD8+ cells µl−1 and the percentage of multimer positive events in peripheral blood samples. The absolute number of CD3+/CD8+ T cells µl−1 in each sample was calculated according to Formula 1 using data derived from the ‘CD8 Count’ tube (A and B). To accomplish this, the number of CD3+/CD8+ events acquired by the flow cytometer (A) was compared to the number of enumeration beads that were also acquired, which were used to determine the fraction of the original sample volume that was collected (B). The acquired number of CD8+ T cells was determined by excluding enumeration beads (R1) and debris (R2) events from the analysis, employing a plot of FSC-A versus SSC-A to resolve these populations. CD3+ events (R3) were identified on a gated plot (NOT R1 and NOT R2) of SSC-A versus PerCP CD3-A, and then a gated plot (NOT R1 and NOT R2 and R3) of LDV-A versus SSC-A was used to identify viable T cells (R4). A gated plot (NOT R1 and NOT R2 and R3 and R4) of FSC-A versus SSC-A was used to discriminate viable, CD3+ T cells that harbored scatter characteristics of lymphocytes (R5). Finally, a gated plot (NOT R1 and NOT R2 and R3 and R4 and R5) of PerCP CD3-A versus FITC CD8-A was used to quantify the number of CD3+/CD8+ T cells (R6) that were acquired from the sample. Thereafter, bead events (R1) were identified on a plot of FSC-A versus SSC-A and were further discriminated from non-bead events by virtue of their high fluorescence intensity (R7) on an R1-gated plot of PE-A versus FITC CD8-A. Single bead events were refined and identified (R8) on a gated plot (R1 and R7) of event chronology (FTIM(1024)) versus FSC-A to assess the compositional homogeneity of acquired beads. The fraction of CD8+ cells that were CAST positive was established in ‘Dextramer’, ‘Tetramer’, ‘Negative Control,’ or ‘FMO’ tubes according to the gating strategy defined in (C). To measure these percentages, CD3+ events were identified on a plot of SSC-A versus PerCP CD3-A (R9), which were then further refined on an R9-gated plot of FSC-A versus SSC-A. CD3+ events having lymphocyte scatter characteristics (R10), were then displayed on a gated plot (R9 and R10) of FITC CD8-A versus PerCP CD3-A, where CD3+/CD8+ T cells were identified (R11). Dead cells (R12) were excluded from the analysis via a gated plot (R9 and R10 and R11) of SSC-A versus LDV-A. Finally, gated plots (R9 and R10 and R11) of FITC CD8-A versus PE Multimer-A that either excluded (R13–R16) or included (R17–R20) dead cells were used to measure the percentage of multimer positive (R14 or R18) events amongst total gated CD3+/CD8+ events. When samples are of good quality or when CAST frequencies are high, the effect of dead cell exclusion may not be readily apparent; however, dead cell exclusion is particularly beneficial when sample viability is sub-optimal or when CAST frequencies are low. Bivariate histograms of FITC CD8-A versus PE-Multimer-A from a separate, multimer-negative sample are gated as described in (C) to demonstrate how dead cell exclusion reduces false positive detection in such cases (D).
Fig. 2
Fig. 2
Determining the linearity of the Dextramer assay. Titration series were generated from blood samples known to contain CMV-reactive T cells, in order to determine the lowest quantity of CASTs that could be accurately measured when employing Dextramer reagents. Seven different Dextramers were used to quantify the number of CASTs µl−1 at 15 distinct quarter-log dilutions of blood from CAST-positive samples. Whole blood from a validated CAST-negative donor was used to dilute CAST-positive blood samples across three logs of titration. A titratable effect was observed in all cases. Dependent upon the specificity of the Dextramer, the titration point at which a dilution effect could no longer be observed was consistently measured to be ~0.2–0.5% of the undiluted sample. [Color figure can be viewed in the online issue, which is available at wileyonlinelibrary.com.]
Fig. 3
Fig. 3
Dextramer reagents are comparable to iTAg™ MHC Tetramer reagents for quantifying the number of CASTs in whole blood. Ninety-five peripheral blood samples were assayed for CASTs in parallel, using both Dextramers and iTAg™ MHC Tetramers. For each patient sample, the absolute number of CASTs µl−1 was calculated using both platforms. Linear regression analysis of the plotted data set reveals a Coefficient of Determination of 0.9042 for all samples, indicating that both Dextramers and Tetramers are equally capable of detecting CASTs in patient samples. Inset: Expanded view of graph, showing the correlation for CASTs measured by Dextramer and Tetramer at values of less than 10 CASTs µl−1.
Fig. 4
Fig. 4
Dextramer reagents are stable for at least one year. A Fluorescence Intensity Integrity assay was performed to evaluate the stability characteristics of Dextramer reagents over time (A). Seven distinct PE-conjugated Dextramer reagents were synthesized and then assayed on days 1, 41, 110, 183, and 365 post-manufacturing for the ability to bind to an anti-β2-microglobulin-coated plate. Spectrophotometric measurements of PE emission were used to calculate a ‘Test Value’ (TV), (see Formulae 3–5 in the ‘Supporting Information and Methods’ section). The average TV for triplicate samples at each time point is plotted for Dextramer reagents of 7 different haplotypes and peptide specificities. These data demonstrate that for each reagent preparation tested, the amount of compositionally-intact Dextramer reagent is consistent over the course of the assay. The same lots of Dextramer reagents were also evaluated in a flow cytometric assay to demonstrate functional stability (B). These data demonstrate that for any given Dextramer reagent, the measured percentage of CASTs in PBMC samples is consistent over time, further indicating that Dextramer reagents are functionally stable for at least one year.
Fig. 5
Fig. 5
The accurate measurement of CASTs with Dextramers is independent of the acquisition instrumentation employed. CASTs in peripheral blood samples from 10 or 15 patients were measured in parallel using 3 separate instruments (A–C). Regardless of instrument manufacturer or the use of analog or digital circuitry, the measured number of Dextramer positive CD8+ T cells µl−1 was consistent at high (>20), medium (>10 and <20) and low (<10) levels of CASTs for every combination of instruments. Linear regression analyses of the pooled data sets reveal R2 values of 0.9923 (FC 500 versus Calibur, n= 10), 0.9556 (FC 500 versus Calibur, n= 10), and 0.9068 (Calibur versus Canto II, n= 15), demonstrating the robustness of the Dextramer reagent in measuring antigen-specific T cells with different instruments. Decuplet measurements of CASTs µl−1, for each of the 10 or 15 samples were highly reproducible regardless of the instrument that was utilized (D). Error bars represent the standard deviation of the mean.
Fig. 6
Fig. 6
Low inter-lab variability is obtained when Dextramer reagents are used to measure CASTs. Nine peripheral blood samples were assayed in parallel at two different laboratories to determine the amount of intra-lab variability that existed when measuring CASTs using Dextramers. The absolute number of CMV-specific T cells µl−1 of blood were determined for each sample at both facilities. Linear regression analysis of the plotted data reveals a close correlation (R2 = 0.9947) for these measurements, indicating that Dextramers can be used for reliable enumeration of CASTs in different laboratory environments.

References

    1. Altman JD, Moss PA, Goulder PJ, Barouch DH, McHeyzer-Williams MG, Bell JI, McMichael AJ, Davis MM. Phenotypic analysis of antigen-specific T lymphocytes. Science. 1996;274:94–96. - PubMed
    1. Matsui K, Boniface JJ, Reay PA, Schild H, Fazekas de St Groth B, Davis MM. Low affinity interaction of peptide-MHC complexes with T cell receptors. Science. 1991;254:1788–1791. - PubMed
    1. Davis MM, Boniface JJ, Reich Z, Lyons D, Hampl J, Arden B, Chien Y. Ligand recognition by alpha beta T cell receptors. Annu Rev Immunol. 1998;16:523–544. - PubMed
    1. Wooldridge L, Lissina A, Cole DK, van den Berg HA, Price DA, Sewell AK. Tricks with tetramers: How to get the most from multimeric peptide-MHC. Immunology. 2009;126:147–164. - PMC - PubMed
    1. Bakker AH, Schumacher TN. MHC multimer technology: current status and future prospects. Curr Opin Immunol. 2005;17:428–433. - PubMed

Publication types

MeSH terms