. 2014 Nov 4;111(44):E4726-35.
doi: 10.1073/pnas.1404656111. Epub 2014 Oct 22.

Single-cell analyses of transcriptional heterogeneity during drug tolerance transition in cancer cells by RNA sequencing

Affiliations

Single-cell analyses of transcriptional heterogeneity during drug tolerance transition in cancer cells by RNA sequencing

Mei-Chong Wendy Lee et al. Proc Natl Acad Sci U S A. .

Abstract

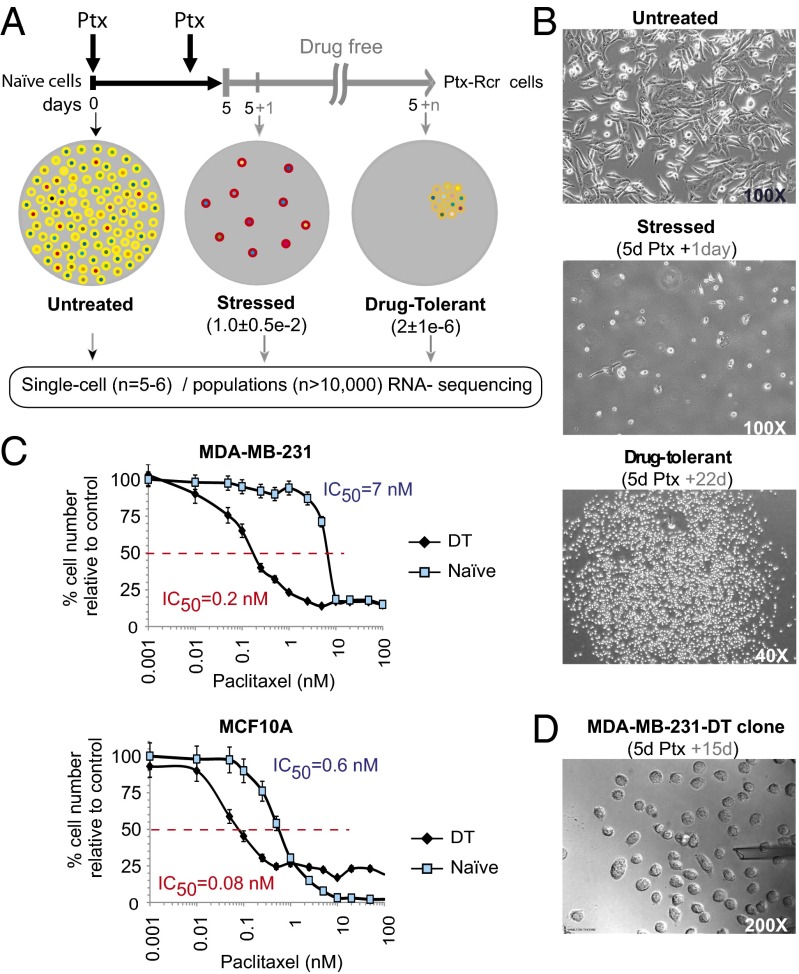
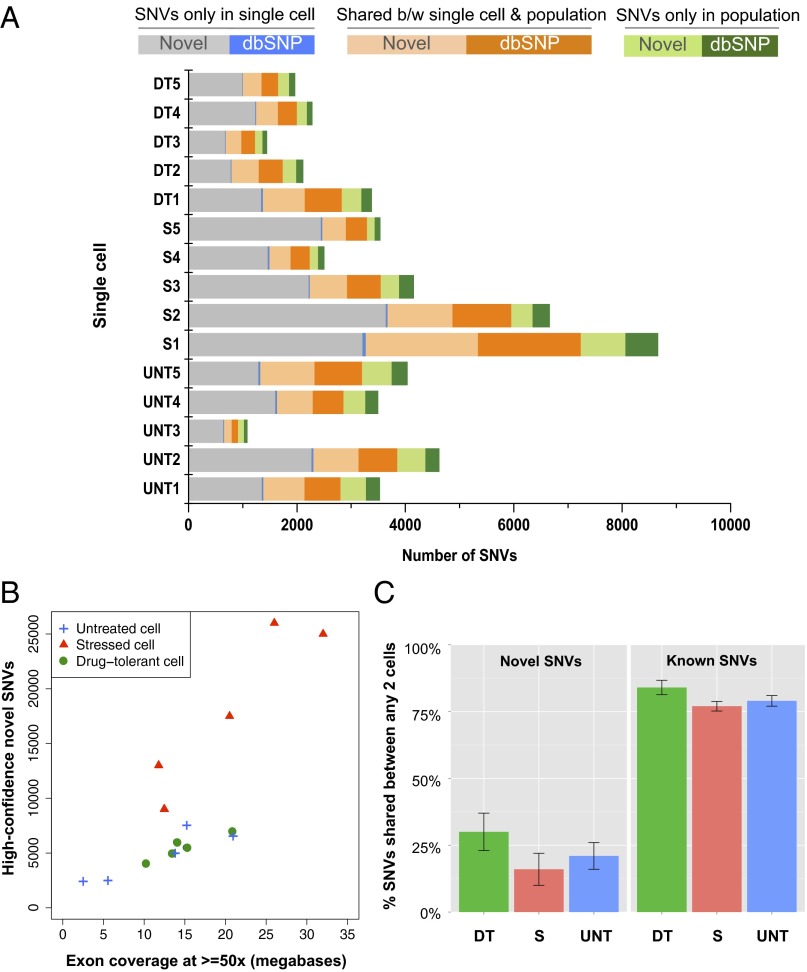
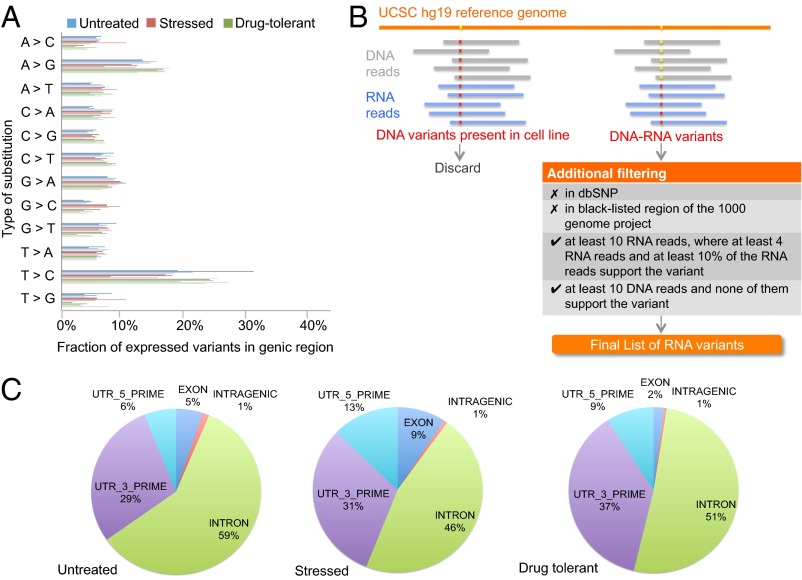
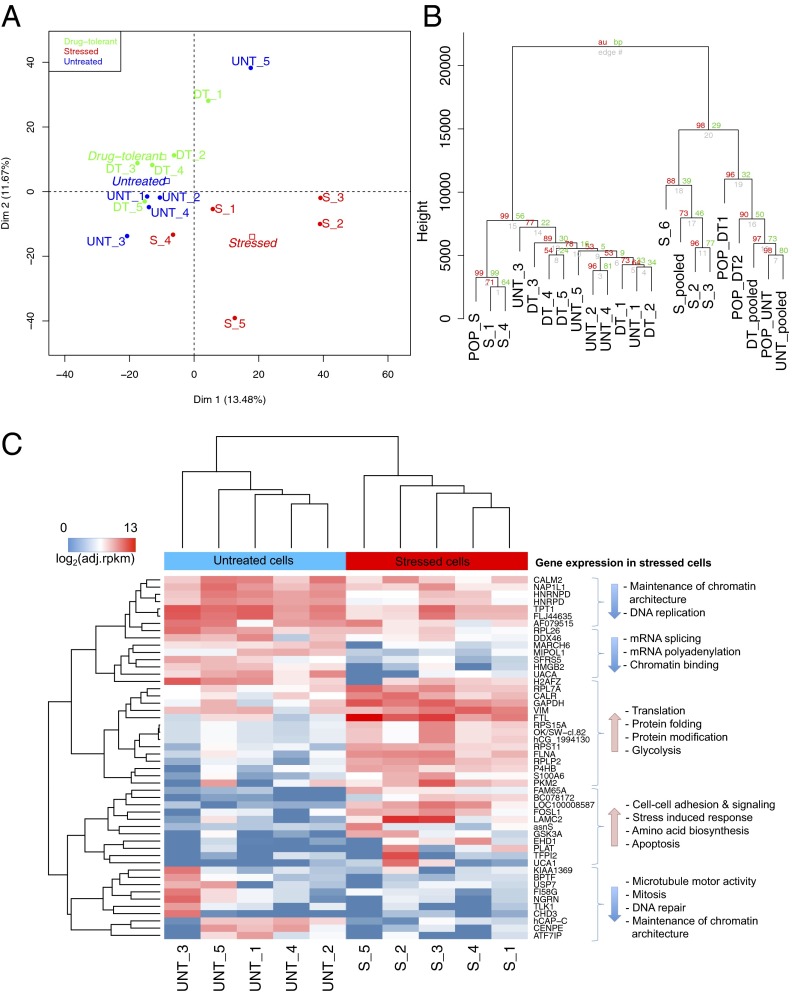
The acute cellular response to stress generates a subpopulation of reversibly stress-tolerant cells under conditions that are lethal to the majority of the population. Stress tolerance is attributed to heterogeneity of gene expression within the population to ensure survival of a minority. We performed whole transcriptome sequencing analyses of metastatic human breast cancer cells subjected to the chemotherapeutic agent paclitaxel at the single-cell and population levels. Here we show that specific transcriptional programs are enacted within untreated, stressed, and drug-tolerant cell groups while generating high heterogeneity between single cells within and between groups. We further demonstrate that drug-tolerant cells contain specific RNA variants residing in genes involved in microtubule organization and stabilization, as well as cell adhesion and cell surface signaling. In addition, the gene expression profile of drug-tolerant cells is similar to that of untreated cells within a few doublings. Thus, single-cell analyses reveal the dynamics of the stress response in terms of cell-specific RNA variants driving heterogeneity, the survival of a minority population through generation of specific RNA variants, and the efficient reconversion of stress-tolerant cells back to normalcy.

Keywords: RNA-Seq; drug resistance; paclitaxel; single cell; tumor heterogeniety.


Conflict of interest statement

The authors declare no conflict of interest.

Figures

Fig. 1.
Fig. 1.
Reversible phenotypic equilibrium in response to paclitaxel in cancer cells. (A) Regimen for expansion of paclitaxel (Ptx) stress-tolerant cells. Highly metastatic MDA-MB-231 naïve (yellow) cells were treated with Ptx (100 nM) on day 1 and day 3. After 5 d, Ptx was removed, and cells were left in a drug-free culture. Most stressed cells arrested (red) and ultimately died, whereas rare drug-tolerant cells (orange) resumed proliferation after 10–15 d, and clones were expanded. Five single cells per group were analyzed either before treatment, 1 d after Ptx removal, as well as from recently established (n < 64) or long-term expanded, drug-tolerant clones. Populations were analyzed from long-term expanded clones. Frequencies of surviving stressed and drug-tolerant cells observed are indicated between parentheses. Cell-to-cell heterogenous RNA content is indicated with varying colors. (B) Bright field images of untreated, stressed, and drug-tolerant cells at the indicated times after drug removal. Total magnification is indicated. (C) Paclitaxel toxicity assays on naïve or drug-tolerant MDA-MB-231 cells (Upper) and MCF10A cells (Lower). Growth inhibitory concentrations 50% (IC50) are indicated. Data shown are the mean ± SEM from a quadruplicated representative experiment. (D) Bright-field image of an MDA-MB-231-Ptx-tolerant clone (n < 64) during single cell collection by micromanipulation. The number of days in drug-free culture is indicated at the top. The opening of the micropipette of roughly 20 μm is shown. Total magnification is indicated.
Fig. 2.
Fig. 2.
SNVs identified at the single cell level. (A) The percentage of SNVs shared between single cells and their corresponding population was small. The majority of novel variants in single cells were unique (gray bars) and not detected at the population level. Most of the common variants that were present in a single cell and its corresponding population were known variants cataloged in dbSNP (orange bars). A relatively small number of unique SNVs were detected in the population in genomic regions that had read coverage in both the single cell and population (green bars). Also see SI Appendix, Table S4. (B) There were highly disparate variant rates within the different treatment conditions. Single cells from the stressed cell group (red triangles) contained about two times more novel SNVs than did single untreated cells or single drug-tolerant cells. Drug-tolerant cells had a variant rate similar to that of untreated cells. (C, Left) Cell-to-cell novel SNVs comparison. Novel variants are the ones that are not present in the dbSNP database. We only considered SNVs in genomic regions where both single cells have at least 10 reads in the cell-to-cell comparison; therefore, the differences between two cells are not due to the differing amount of coverage. The bar plot shows the average percent of novel shared variants between any two single cells for each group. (Right) Most known variants present in one cell were present in another cell of any different group. The bar plot shows the average percent of known (dbSNP) shared variants between any two single cells for each group. Also see SI Appendix, Fig. S3.
Fig. 3.
Fig. 3.
RNA variants identified at the single-cell level. (A) The distribution of the 12 RNA variants at the single-cell level showed that the most abundant types of RNA variants were A-to-G and T-to-C. (B) Multiple filters were applied to identify candidate RNA variants. Any SNV in the DNA of the cell line that did not match the human genome reference was considered to be a DNA variant specific to the MDA-MB-231 cell line. DNA-RNA variants were those in which the base call in the single cell RNA reads differed from that in the cell line DNA reads, and the base call in the reference genome agreed with that in the cell line DNA. The DNA-RNA variants were first subjected to two filters that removed all known variants and variants that were not within the accessible genome defined by the 1000 Genome Project Consortium. Two filters were applied to the rest of the DNA-RNA variants to ensure that the RNA variants have enough sequencing reads to support an RNA variant call. (C) The distribution of A-to-G RNA variants relative to gene boundaries. The majority of the A-to-G RNA variants were clustered in noncoding regions including introns and 5′ and 3′ UTRs. Also see SI Appendix, Tables S7 and S8.
Fig. 4.
Fig. 4.
Gene expression analyses. (A) The clustering gene expression data in adjusted-RPKM using PCA showed that gene expression profiles of stressed cells (red) were much different from those of untreated (green) and drug-tolerant cells (black). (B) Hierarchical clustering of gene expression data for single cells, pooled cells, and population cells in Euclidean distance with 1,000 bootstrap replications. Values at branches are approximately unbiased (AU) P values (Left), bootstrap probability (BP) values (Right), and single-cell labels (Lower). (C) Hierarchical clustering of gene expression data for the 50 most significant differentially expressed genes between untreated and stressed single cells: P < 0.001, false discovery rate < 0.025. Also see SI Appendix, Fig. S4.

References

    1. Siegel R, Naishadham D, Jemal A. Cancer statistics, 2012. CA Cancer J Clin. 2012;62(1):10–29. - PubMed
    1. Bock C, Lengauer T. Managing drug resistance in cancer: Lessons from HIV therapy. Nat Rev Cancer. 2012;12(7):494–501. - PubMed
    1. Gottesman MM. Mechanisms of cancer drug resistance. Annu Rev Med. 2002;53:615–627. - PubMed
    1. Mardis ER. A decade’s perspective on DNA sequencing technology. Nature. 2011;470(7333):198–203. - PubMed
    1. Kan Z, et al. Diverse somatic mutation patterns and pathway alterations in human cancers. Nature. 2010;466(7308):869–873. - PubMed

Publication types

MeSH terms

Associated data