. 2014 Oct 23:12:83.
doi: 10.1186/s12915-014-0083-3.

Adaptation to prolonged neuromodulation in cortical cultures: an invariable return to network synchrony

Adaptation to prolonged neuromodulation in cortical cultures: an invariable return to network synchrony

Maya Kaufman et al. BMC Biol. .

Abstract

Background: Prolonged neuromodulatory regimes, such as those critically involved in promoting arousal and suppressing sleep-associated synchronous activity patterns, might be expected to trigger adaptation processes and, consequently, a decline in neuromodulator-driven effects. This possibility, however, has rarely been addressed.

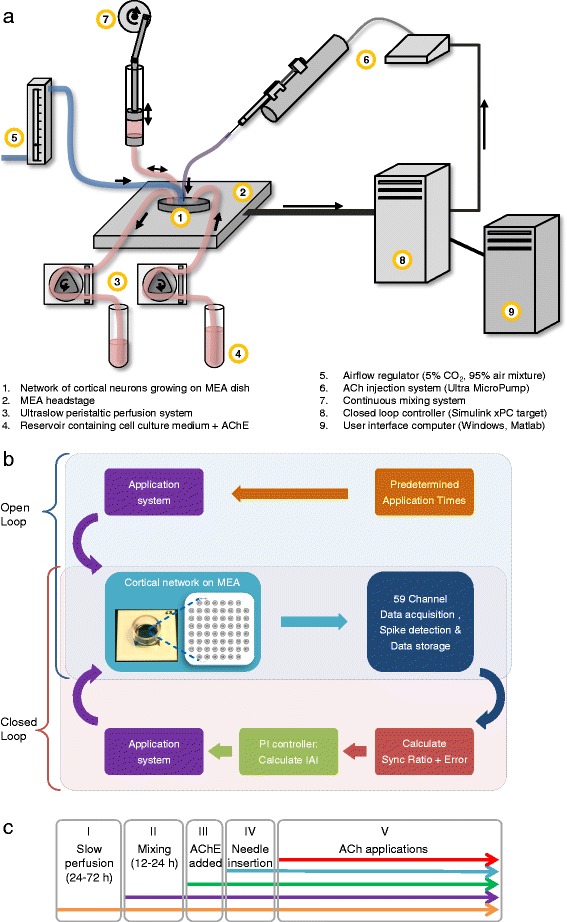
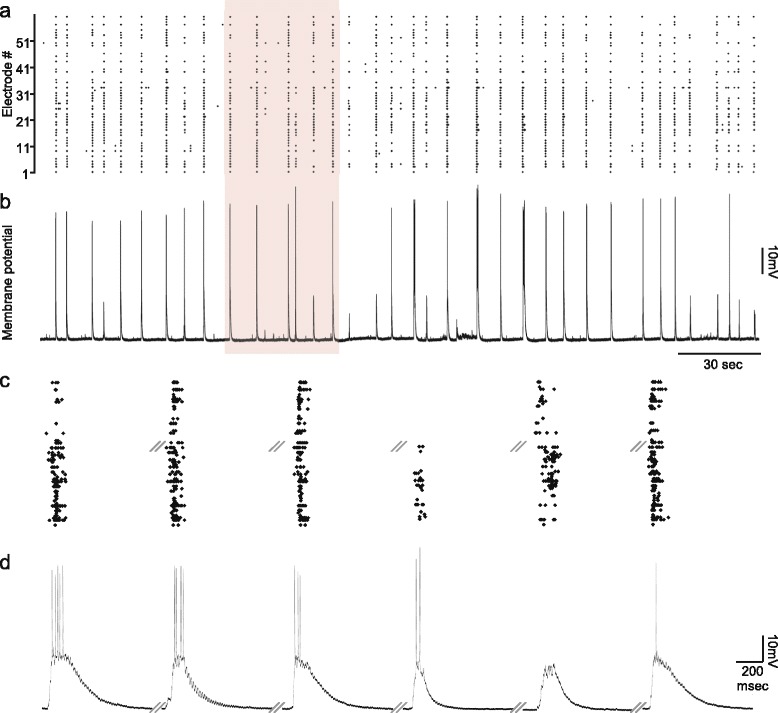
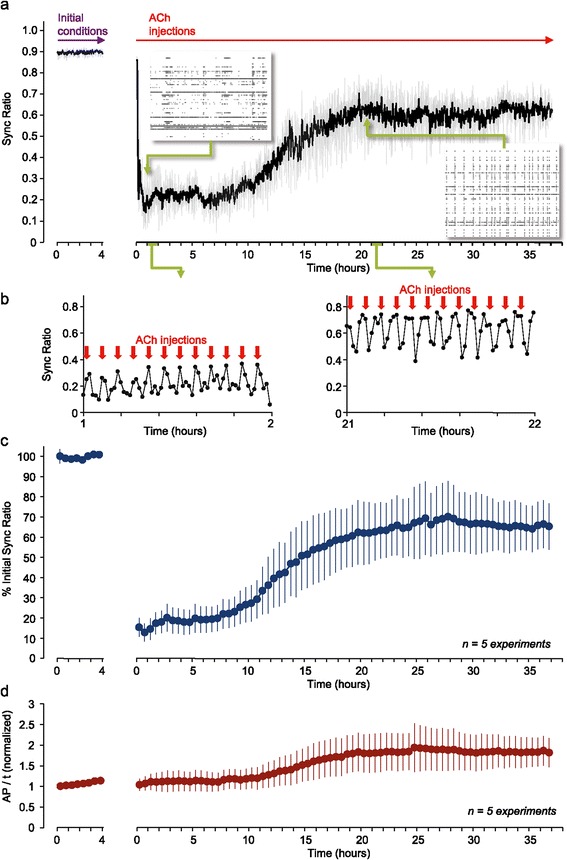
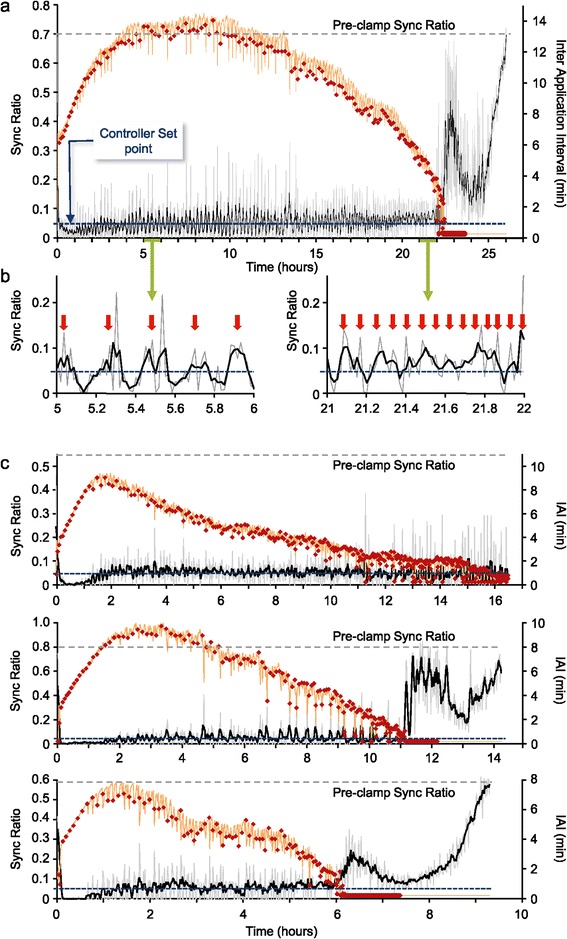
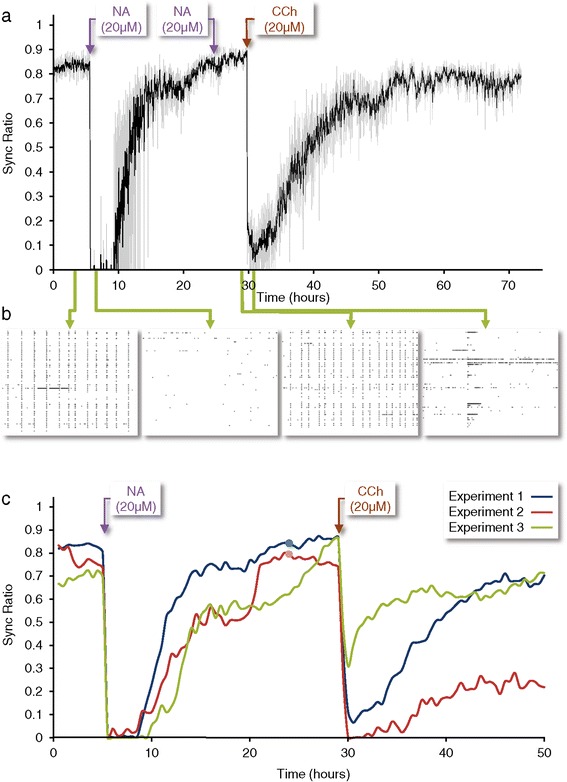
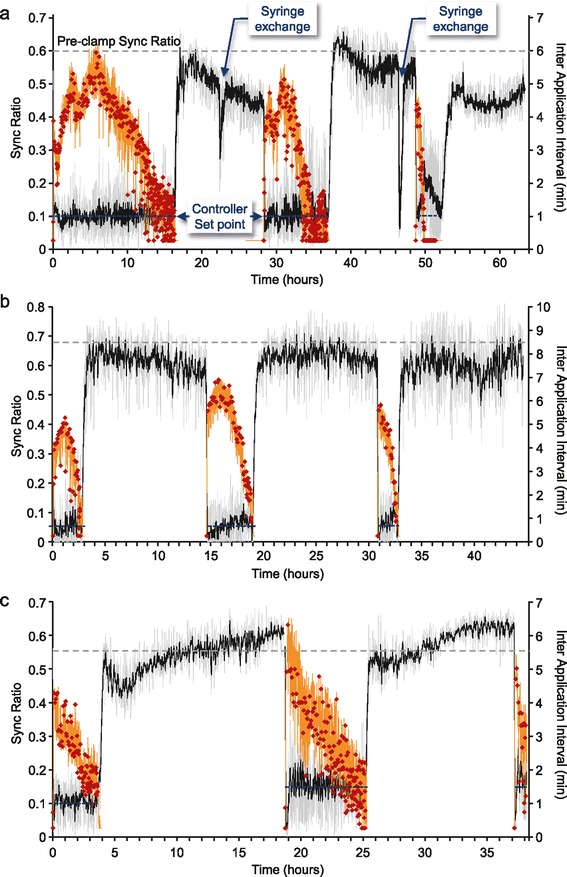
Results: Using networks of cultured cortical neurons, acetylcholine microinjections and a novel closed-loop 'synchrony-clamp' system, we found that acetylcholine pulses strongly suppressed network synchrony. Over the course of many hours, however, synchrony invariably reemerged, even when feedback was used to compensate for declining cholinergic efficacy. Network synchrony also reemerged following its initial suppression by noradrenaline, but this did not occlude the suppression of synchrony or its gradual reemergence following subsequent cholinergic input. Importantly, cholinergic efficacy could be restored and preserved over extended time scales by periodically withdrawing cholinergic input.

Conclusions: These findings indicate that the capacity of neuromodulators to suppress network synchrony is constrained by slow-acting, reactive processes. A multiplicity of neuromodulators and ultimately neuromodulator withdrawal periods might thus be necessary to cope with an inevitable reemergence of network synchrony.


Figures

Figure 1
Figure 1
Setup used to examine long-term effects of ACh applications on network synchrony in open-and closed-loop regimes. a) Schematic illustration of the experimental system used to record from neurons growing on MEA substrates, maintain their viability, and apply ACh pulses at predetermined rates or at rates adjusted online to maintain network synchrony at predefined levels. b) Schematic illustration of open- and closed-loop experimental protocols. Note that in open-loop experiments ACh application timings are predefined, whereas in closed-loop experiments, ACh application timings are determined online according to instantaneous Sync Ratio values calculated by the real-time controller (item 8 in a, see Additional file 3: Figure S3 for an explanation of the Sync Ratio measure). c) Preparatory and experimental phases. Each experiment was preceded by the following preparatory phases: Phase I, slow perfusion (at least 24 hours); Phase II, activation of continuous mixing system (12 to 24 hours); Phase III, addition of AChE (0.1 U/ml) to the MEA dish and perfusion media reservoir (30 minutes, see Additional file 7: Figure S6 for the importance of AChE addition); Phase IV, insertion of ACh application needle into the MEA dish; and Phase V, experiment (open or closed loop). Note that the experimental component added in each phase was in effect from that moment until the end of the experiment. See Methods for further details. ACh, acetylcholine; AChE, acetylcholine esterase; MEA, multielectrode array.
Figure 2
Figure 2
Synchronous bursts and quiescent periods are well correlated with neuronal membrane potential depolarization (‘up’ states) and hyperpolarization (‘down’ states). Combined intracellular whole-cell patch clamp and extracellular recordings from neurons growing on MEA substrates are shown. a) A raster plot depicting 260 seconds of network activity recorded from 59 extracellular electrodes. Each point represents an action potential recorded from that electrode. b) Concomitant intracellular recording of membrane potential from one neuron in the network over the same period. An excellent correspondence between membrane potential depolarizations and network-wide bursting is evident. c) Six events from the pink rectangle in a, shown at higher temporal resolution. d) Corresponding intracellular voltage traces for the same events shown in c. Note that each network burst is associated with strong membrane depolarization, usually crowned by one or more action potentials. These events are remarkably similar to cortical ‘up’ states observed in sleeping and anesthetized animals. Each trace in c and d is one second long. Backslashes denote omitted time periods. The initial membrane potential in b and d was approximately -55 mV. MEA, multielectrode array.
Figure 3
Figure 3
Synchronous activity reemerges following semi-phasic, periodic ACh applications. a) Sync Ratio over time in one experiment (grey; same data after smoothing with a five-point kernel is shown in black), performed in an open-loop regime. ACh pulses were delivered once every five minutes, starting at t =5 minutes. Note the high values of the Sync Ratio in the period preceding ACh applications (initial conditions, obtained during the period defined as phase II in Figure 1c; see also Additional file 1: Figure S1) and the huge reduction in Sync Ratio values once ACh applications were initiated. Insets: examples of one-minute raster plots from early (left) and late (right) stages of the experiment. b) Enlarged one-hour sections of the plot shown in a from early (left) and late (right) stages of the experiment. Red arrows denote application times. c) Changes in Sync Ratio over time in five separate experiments similar to the experiment shown in a. For each experiment, Sync Ratio values, averaged over 30 minutes, were normalized to the average Sync Ratio measured during the 4 hour period preceding ACh application (initial conditions). Average ± SEM for five experiments. d) Total firing rates measured from all electrodes, averaged over 30 minute intervals, normalized for each experiment to the average firing rate measured during the 4 hour period preceding ACh application (Initial conditions). Note that the initiation of ACh applications was not associated with changes in overall firing rates. Average ± SEM for five experiments. ACh, acetylcholine; SEM, standard error of the mean.
Figure 4
Figure 4
Using feedback to adjust cholinergic input allows clamping of network synchrony at low levels, but not indefinitely. a) One closed-loop experiment. Network activity was clamped to a desynchronized activity state (Sync Ratio =0.05). The Sync Ratio, calculated online, is shown as a grey line (corresponding to the left vertical y-axis) and after smoothing with a five-point kernel (black). The inter application interval (IAI), calculated online is shown as an orange line (corresponding to the right vertical y-axis). Each red dot denotes a single ACh application, and the actual time difference from the previous application. The Sync Ratio value preceding the first ACh application is indicated as a dashed gray line. b) Enlarged one-hour sections of the plot in a, from early (left) and late (right) stages of the experiment. Red arrows denote application times. c) Three additional closed-loop experiments, in which the Sync Ratio was clamped to 0.05. Firing rates for each of the closed-loop experiments are shown in Additional file 8: Figure S7. ACh, acetylcholine.
Figure 5
Figure 5
Network synchrony reemerges following prolonged exposure to NA, but can be re-suppressed by cholinergic input. a) Evolution of the Sync Ratio in one experiment (grey; same data after smoothing with a five-point kernel is shown in black). After recording baseline activity for >72 hours (of which the last approximately six hours are shown), NA (20 μM) was added directly into the MEA dish and the perfusion media reservoir (see Additional file 11: Figure S8 for similar experiments performed with DA). Nineteen hours later, a second bolus of freshly prepared NA was added to the MEA dish. Twenty-four hours after the first NA addition, CCh (20 μM) was added to the MEA dish and perfusion media reservoir and recording was continued for 40 hours. b) Examples of one-minute raster plots from four stages of the experiment as indicated in the figure (green arrows). c) Evolution of Sync Ratio (averaged over 30 minute intervals) in three similar experiments (blue line is the same experiment as in a). In two of these, a second bolus of freshly prepared NA was added to the MEA dish 19 hours later (indicated as small circles on blue and red traces). Note the very limited effect of this second NA application. CCh, carbachol; DA, dopamine; MEA, multielectrode array; NA, noradrenaline.
Figure 6
Figure 6
Withdrawal of cholinergic input for defined periods restores its capacity to suppress network synchrony in subsequent periods. Three multiple epoch experiments are shown using the same notations as in Figure 4. Network activity was clamped to a desynchronized activity level (Sync Ratio = 0.05 for a, b and 0.1 and 0.15 for c). Following the depletion of the ACh in the application syringe (a) or the online calculation of four consecutive IAI values <1.5 minutes (b,c), cholinergic input was removed for 12 hours. After these periods, new closed-loop epochs were initiated, using the same experimental parameters. In the first experiment (a), the syringe was refilled with freshly prepared ACh as indicated in the figure, resulting in some leakage of ACh from the open end of the application needle, and a transient desynchronization of network activity. In the other two experiments (b,c) the syringe was not refilled, and the same ACh, prepared at the beginning of the experiment, was used for the entire duration of the experiments. Firing rates for each of the multi-epoch experiments are shown in Additional file 13: Figure S9. ACh, acetylcholine.

Similar articles

Cited by

References

    1. Marder E. Neuromodulation of neuronal circuits: back to the future. Neuron. 2012;76:1–11. doi: 10.1016/j.neuron.2012.09.010. - DOI - PMC - PubMed
    1. Marder E, Goaillard JM. Variability, compensation and homeostasis in neuron and network function. Nat Rev Neurosci. 2006;7:563–574. doi: 10.1038/nrn1949. - DOI - PubMed
    1. Maffei A, Fontanini A. Network homeostasis: a matter of coordination. Curr Opin Neurobiol. 2009;19:168–173. doi: 10.1016/j.conb.2009.05.012. - DOI - PMC - PubMed
    1. Turrigiano G. Too many cooks? Intrinsic and synaptic homeostatic mechanisms in cortical circuit refinement. Annu Rev Neurosci. 2011;34:89–103. doi: 10.1146/annurev-neuro-060909-153238. - DOI - PubMed
    1. Keck T, Keller GB, Jacobsen RI, Eysel UT, Bonhoeffer T, Hübener M. Synaptic scaling and homeostatic plasticity in the mouse visual cortex in vivo. Neuron. 2013;80:327–334. doi: 10.1016/j.neuron.2013.08.018. - DOI - PubMed

Publication types

LinkOut - more resources