. 2015 Jan 15;465(2):295-303.
doi: 10.1042/BJ20140952.

Exchange protein directly activated by cAMP modulates regulatory T-cell-mediated immunosuppression

Affiliations

Exchange protein directly activated by cAMP modulates regulatory T-cell-mediated immunosuppression

Muayad Almahariq et al. Biochem J. .

Abstract

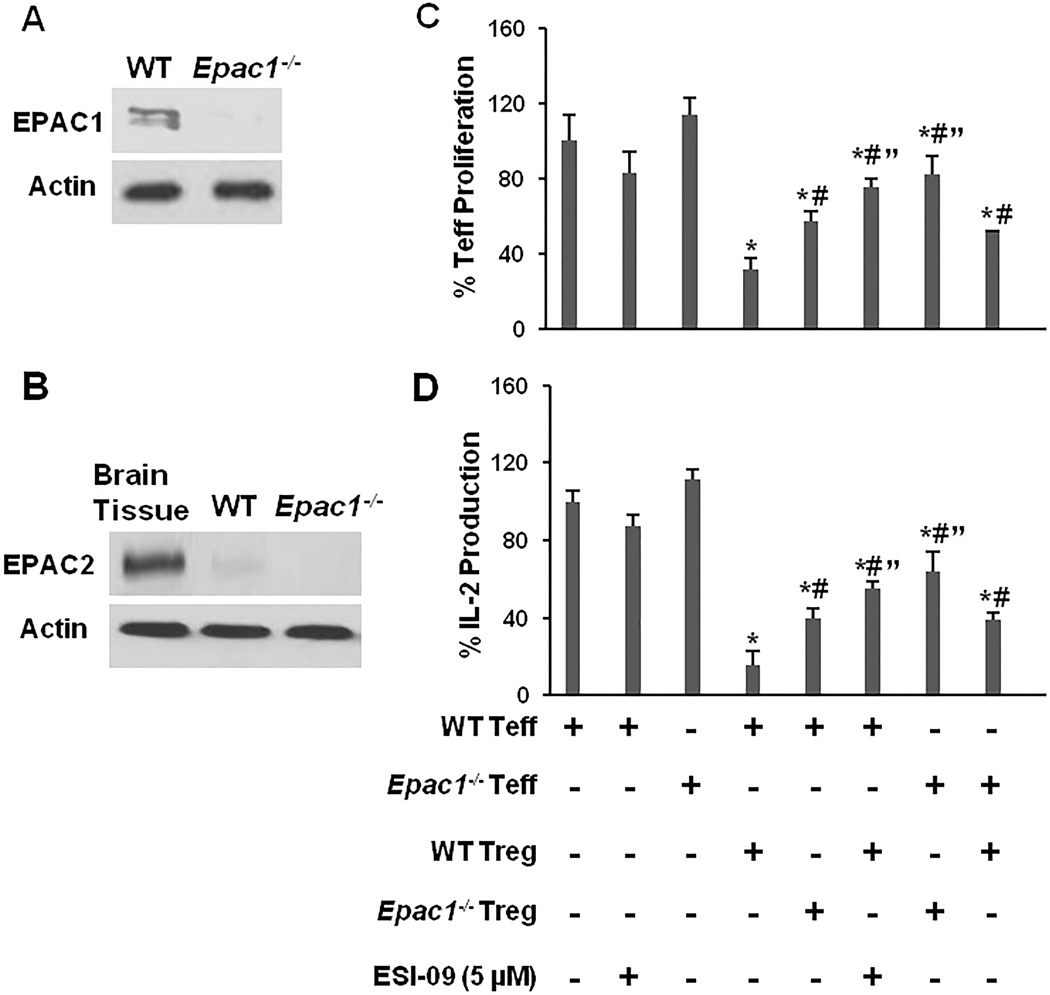
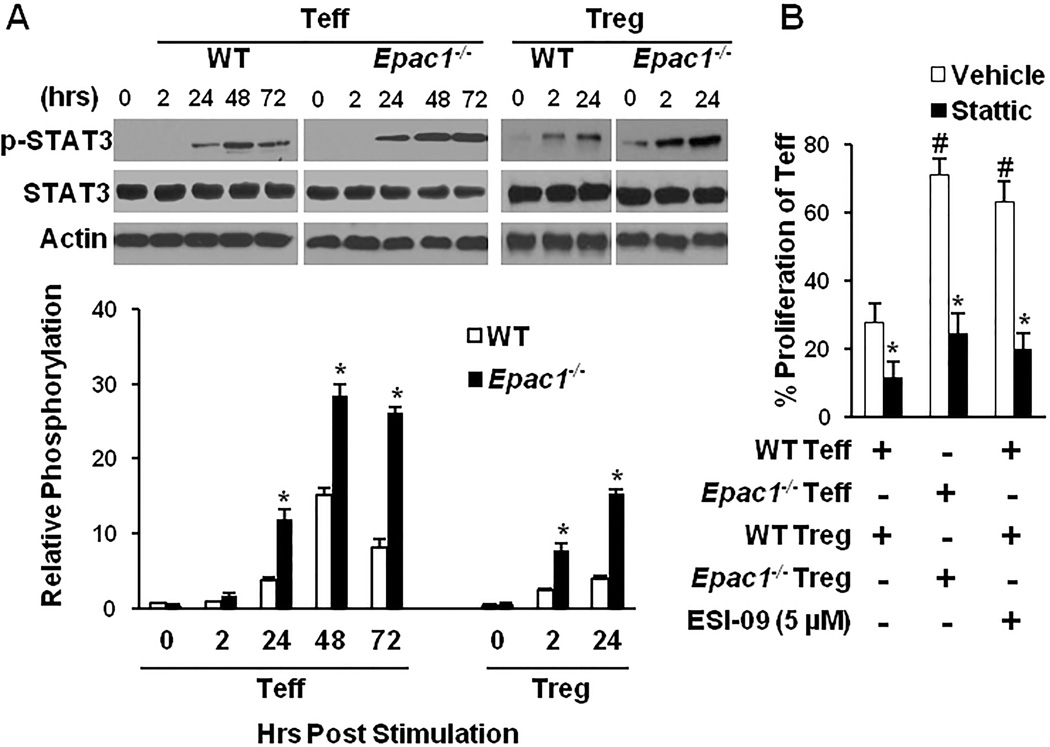
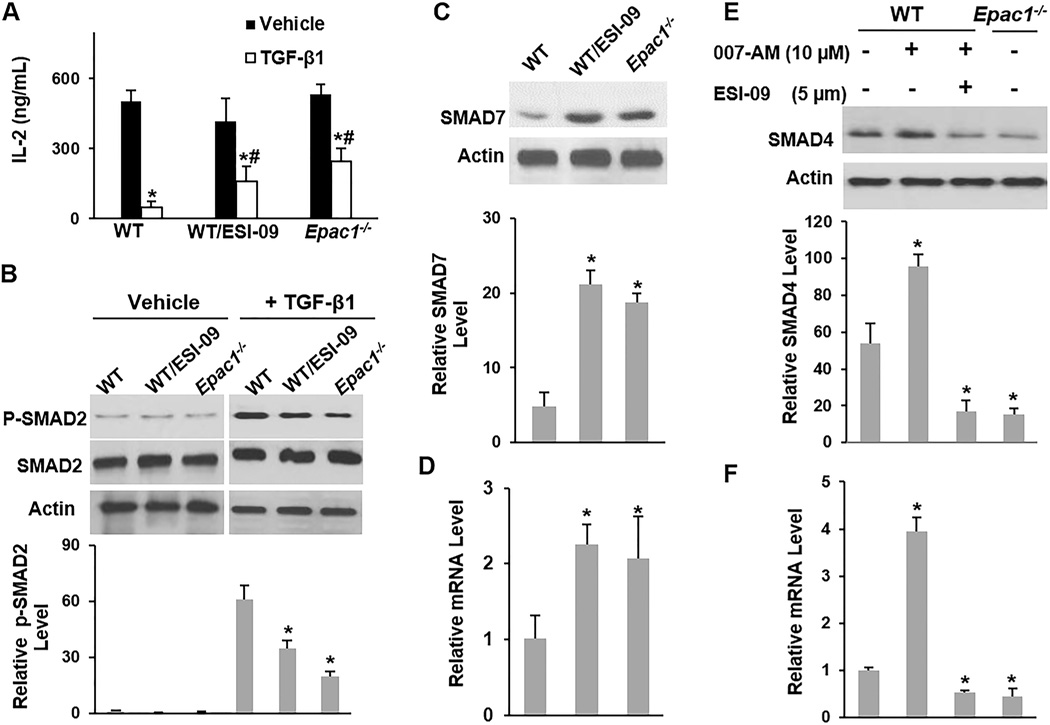
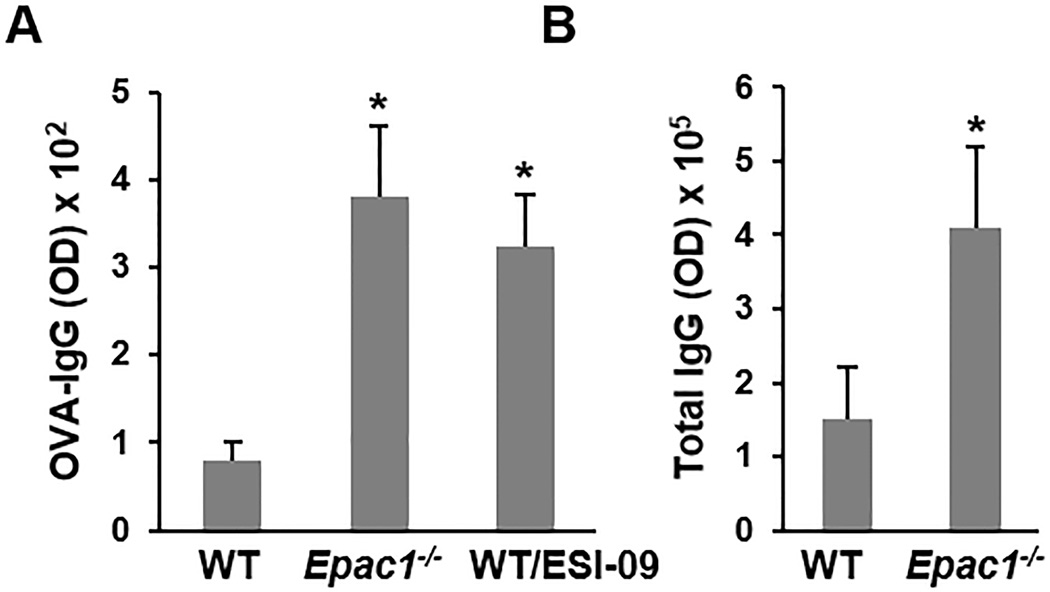
The cAMP signalling pathway plays an essential role in immune functions. In the present study we examined the role of the cAMP/EPAC1 (exchange protein directly activated by cAMP) axis in regulatory T-cell (Treg)-mediated immunosuppression using genetic and pharmacological approaches. Genetic deletion of EPAC1 in Tregs and effector T-cells (Teffs) synergistically attenuated Treg-mediated suppression of Teffs. Mechanistically, EPAC1 inhibition enhanced activation of the transcription factor STAT3 (signal transducer and activator of transcription 3) and up-regulated SMAD7 expression while down-regulating expression of SMAD4. Consequently, CD4+ T-cells were desensitized to transforming growth factor (TGF) β1, a cytokine employed by Tregs to exert a broad inhibitory function within the immune system. Furthermore, deletion of EPAC1 led to production of significant levels of ovalbumin IgG antibodies in a low-dose, oral-tolerance mouse model. These in vivo observations are consistent with the finding that EPAC1 plays an important role in Treg-mediated suppression. More importantly, pharmacological inhibition of EPAC1 using an EPAC-specific inhibitor recapitulates the EPAC1 deletion phenotype both in vivo and in vitro. The results of the present study show that EPAC1 boosts Treg-mediated suppression, and identifies EPAC1 as a target with broad therapeutic potential because Tregs are involved in numerous pathologies, including autoimmunity, infections and a wide range of cancers.


Conflict of interest statement

The authors declare no conflict of interest.

Figures

Figure 1
Figure 1. Deletion or inhibition of EPAC1 diminishes Treg-mediated suppression
(A) and (B) CD4+ T-cells were isolated from 10–12 week old female WT and Epac1−/− mice and probed for EPAC1 and EPAC2 expression. Brain tissue was used as a positive control for detection of EPAC2. (C) Teff cells (5 × 10⁴) were stimulated with plate-bound anti-CD3 (5 µg/mL) and soluble anti-CD28 (2 µg/mL) in the presence or absence of Treg cells (2.5 × 10⁴) and/or ESI-09 (5 µM). Proliferation was measured by determining DNA content 96 hrs later. Samples containing only Treg were used as negative controls. (D) At the end of the proliferation assay, the concentration of IL-2 in the supernatants was measured by ELISA. Data from the vehicle treated Teff only samples (positive controls) was normalized to the WT Teff positive control. Data from the co-culture assays was normalized to the positive control matching the genotype of the Teff cells in the assay. Bars represent mean ± SD of at least 3 experiments. * Significantly lower than the corresponding positive control samples (P < 0.05). # Significantly higher than WT Teff/WT Treg co-culture samples (P < 0.05). " Significantly higher than mixed WT/Epac1−/− co-culture samples (P < 0.05).
Figure 2
Figure 2. Deletion or inhibition of EPAC1 has no impact on gap junction (GJ) mediated intercellular communication between Teff and Treg cells
Treg and Teff cells were loaded with Calcein Red-Orange-AM and CFSE, respectively, and co-cultured for 24 hrs at a 1:1 ratio under plate-bound anti-CD3 (5 µg/mL) and soluble anti-CD28 (2 µg/mL) stimulation. Cellular transfer between Treg and Teff cells was determined by the percentage of cells positive for both dyes. (A) Representative plots showing dye transfer between Treg and Teff. (B) Quantification of dye transfer from three experiments. Bars represent mean ± SD.
Figure 3
Figure 3. EPAC1 modulates Treg-mediated suppression through the STAT3 pathway
(A) Teff or Treg cells were stimulated with plate bound anti-CD3 (5 µg/mL) and soluble anti-CD28 (2 µg/mL) and p-STAT3 (Tyr705) was probed by Western blotting at the indicated time points (one representative blot is shown). p-STAT3 levels were determined by densitometry and expressed as a percentage of total STAT3. * Significantly higher than WT counterpart (P < 0.01). (B) The suppression assay was carried out as described in Fig. 1 in the presence or absence of the STAT3 inhibitor stattic (50 ng/mL) and/or ESI-09 (5 µM). # Significantly higher than vehicle treated WT cells (P < 0.01). * Significantly lower than vehicle treated counterpart (P < 0.05). Bars represent mean ± SD of at least three experiments.
Figure 4
Figure 4. Inhibition of EPAC1 leads to resistance to TGF-β1 signaling
CD4+ T-cells were stimulated with plate bound anti-CD3 (5 µg/mL) and soluble anti-CD28 (2 µg/mL) for 17 hrs in the presence or absence of TGF-β1 (2 ng/mL), ESI-09 (5 µM), and 007-AM (10 µM) as indicated. (A) Supernatants were assayed for IL-2 concentration by ELISA. * Significantly lower than vehicle treated counterpart (P <0.03). # Significantly higher than TGF-β1-treated WT cells (P < 0.05). (B) The level of p-SMAD2 was determined by Western blotting (one representative blot is shown) and expressed as a percentage of total SMAD2. * Significantly lower than TGF-β1-treated WT cells (P <0.02). (C–F) The protein and mRNA levels of SMAD7 or SMAD4 were determined by Western blotting (one representative blot is shown) and qRT-PCR, respectively. Protein levels were expressed as percentage of the loading control actin. mRNA levels were expressed relative to Gapdh RNA levels. * Significantly higher or lower than vehicle treated WT cells (P < 0.03). Bars represent mean ± SD of at least three experiments.
Figure 5
Figure 5. Deletion or inhibition of EPAC1 heightens the immune response
(A) 10–12 week old female mice were administered 100 µg OVA orally on days 1 and 21. ESI-09 treated mice were administered the drug daily (50 mg/kg orally). Serum was collected on day 28 and anti-OVA IgG levels were determined by ELISA (n=5). (B) Serum was collected from naive 10–12 week old female mice and total IgG levels were determined by ELISA (n=8). Data is shown as means ± SD. * Significantly higher than WT group (P < 0.05).

References

    1. Sakaguchi S, Wing K, Onishi Y, Prieto-Martin P, Yamaguchi T. Regulatory T cells: how do they suppress immune responses? Int Immunol. 2009;21:1105–1111. - PubMed
    1. Sakaguchi S, Miyara M, Costantino CM, Hafler DA. FOXP3+ regulatory T cells in the human immune system. Nat Rev Immunol. 2010;10:490–500. - PubMed
    1. Kirkwood JM, Butterfield LH, Tarhini AA, Zarour H, Kalinski P, Ferrone S. Immunotherapy of cancer in 2012. CA Cancer J Clin. 2012;62:309–335. - PMC - PubMed
    1. Beyer M, Schultze JL. Regulatory T cells in cancer. Blood. 2006;108:804–811. - PubMed
    1. Dodson LF, Hawkins WG, Goedegebuure P. Potential targets for pancreatic cancer immunotherapeutics. Immunotherapy. 2011;3:517–537. - PMC - PubMed

Publication types

MeSH terms