. 2015 Jan 15;113(2):409-19.
doi: 10.1152/jn.00005.2014. Epub 2014 Oct 22.

On the contributions of vision and proprioception to the representation of hand-near targets

Affiliations

On the contributions of vision and proprioception to the representation of hand-near targets

Liana E Brown et al. J Neurophysiol. .

Abstract

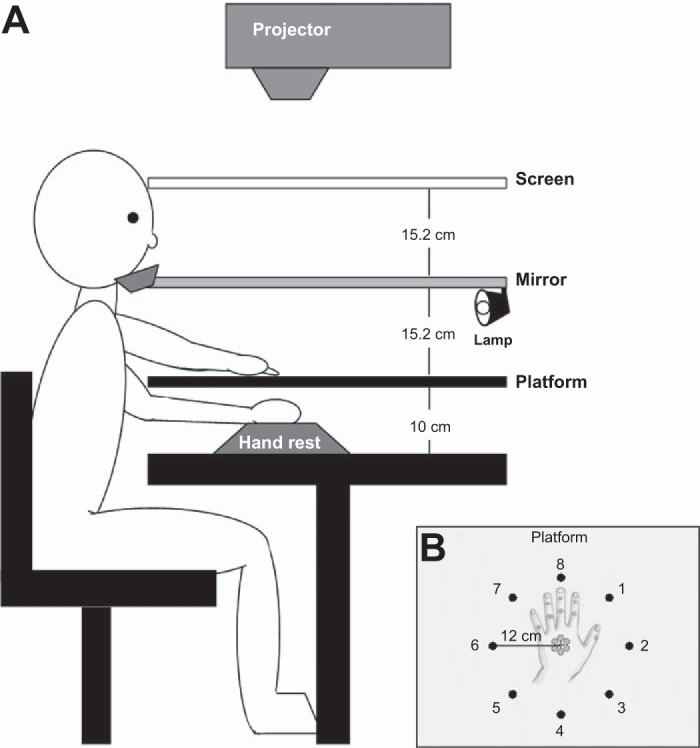
Performance is often improved when targets are presented in space near the hands rather than far from the hands. Performance in hand-near space may be improved because participants can use proprioception from the nearby limb and hand to provide a narrower and more resolute frame of reference. An equally compelling alternative is that targets appearing near the hand fall within the receptive fields of visual-tactile bimodal cells, recruiting them to assist in the visual representation of targets that appear near but not far from the hand. We distinguished between these two alternatives by capitalizing on research showing that vision and proprioception have differential effects on the precision of target representation (van Beers RJ, Sittig AC, Denier van der Gon JJ. Exp Brain Res 122: 367-377, 1998). Participants performed an in-to-center reaching task to an array of central target locations with their right hand, while their left hand rested near (beneath) or far from the target array. Reaching end-point accuracy, variability, time, and speed were assessed. We predicted that if proprioception contributes to the representation of hand-near targets, then error variability in depth will be smaller in the hand-near condition than in the hand-far condition. By contrast, if vision contributes to the representation of hand-near targets, then error variability along the lateral dimension will be smaller in the hand-near than in the hand-far condition. Our results showed that the placement of the hand near the targets reduced end-point error variability along the lateral dimension only. The results suggest that hand-near targets are represented with greater visual resolution than far targets.

Keywords: attention; frames of reference; motor control; multisensory integration; peripersonal space; sensory resolution; visual processing.


Figures

Fig. 1.
Fig. 1.
Experimental set up. A: the arrangement of the screen, mirror, and platform surfaces relative to the participant, projector, and handrest. B: the arrangement of the potential start (black) and target positions (gray). Start and target images were projected onto the screen but appeared to be on the platform. The platform was opaque and appears to be transparent here for illustration purposes only. The hand was placed beneath the platform and was not visible to the participants. An outline of its position relative to the targets and start positions is shown here.
Fig. 2.
Fig. 2.
Results from Experiment 1. A and B: the end position with respect to the target location (i.e., the end-point error) for every reaching movement for all participants (∘) in the hand-far and hand-near conditions, respectively. The black crosses represent the target location, and the gray crosses show the average signed reaching error. The ellipses represent the range containing 90% of the data in each condition and whose cardinal axes span from the fifth to the 95th percentiles for the error data along the lateral dimension and in depth. C and D: mean variability along the horizon and in depth, respectively, as a function of hand presence. E and F: mean movement time (MT), and peak velocity (PV), respectively, as a function of hand presence. In all panels, error bars represent the SE.
Fig. 3.
Fig. 3.
Scatterplot depicting the mean change in variability as a function of hand condition (hand present − hand absent) along the lateral and depth dimensions for each participant. Participants from Experiment 1 are shown as black dots, and participants from Experiment 2 are shown as gray dots. Participants to the left of the vertical 0 line showed reduced lateral variability with the addition of the hand to the display. Participants below the horizontal 0 line showed reduced variability in depth with the addition of the hand to the display. Whereas there is a fairly even distribution around the horizontal line, there are a greater number of participants to the left of the vertical line than to the right in both experiments.
Fig. 4.
Fig. 4.
Signed lateral error (cm) as a function of reaching start location. In general, participants consistently reached to the left of the target, and in this graph, more negative values represent a larger error to the left of the target. These errors were larger when participants were reaching away from their body (start positions 3–5) and smaller when participants reached toward their body (start positions 1, 7, and 8). This pattern was consistent across the 2 experiments. Error bars represent the SE.
Fig. 5.
Fig. 5.
Mean reaction time (ms), mean MT (ms), and mean tangential PV (mm/s) as a function of reaching start location. A and B: results from Experiments 1 and 2, respectively.
Fig. 6.
Fig. 6.
Results from Experiment 2. A and B: the end position with respect to the target location (i.e., the end-point error) for every reaching movement for all participants (∘) in the hand-far and hand-near conditions, respectively. The black crosses represent the target location, and the gray crosses show the average signed reaching error. The ellipses represent the range containing 90% of the data in each condition and whose cardinal axes span from the 5th to the 95th percentiles for the error data along the lateral dimension and in depth. C and D: mean variability along the horizon and in depth, respectively, as a function of hand presence. E and F: mean MT and PV, respectively, as a function of hand presence. In all panels, error bars represent the SE.

References

    1. Abrams R, Davoli C, Du F, Knapp Paull D W. Altered vision near the hands. Cognition 107: 1035–1047, 2008. - PubMed
    1. Bernier PM, Grafton ST. Human posterior parietal cortex flexibly determines reference frames for reaching based on sensory context. Neuron 68: 776–778, 2010. - PubMed
    1. Brainard DH. The psychophysics toolbox. Spat Vis 10: 433–436, 1997. - PubMed
    1. Brown LE, Kroliczak G, Demonet J, Goodale MA. A hand in blindsight: hand placement near target improves size perception in blind visual field. Neuropsychologia 46: 786–802, 2008. - PubMed
    1. Brown LE, Morrissey B, Goodale MA. Vision in the palm of your hand. Neuropsychologia 47: 1621–1626, 2009. - PubMed

Publication types

LinkOut - more resources