. 2015 Jan 15;113(2):550-66.
doi: 10.1152/jn.00378.2014. Epub 2014 Oct 22.

Calcium spike-mediated digital signaling increases glutamate output at the visual threshold of retinal bipolar cells

Affiliations

Calcium spike-mediated digital signaling increases glutamate output at the visual threshold of retinal bipolar cells

Mikhail Y Lipin et al. J Neurophysiol. .

Abstract

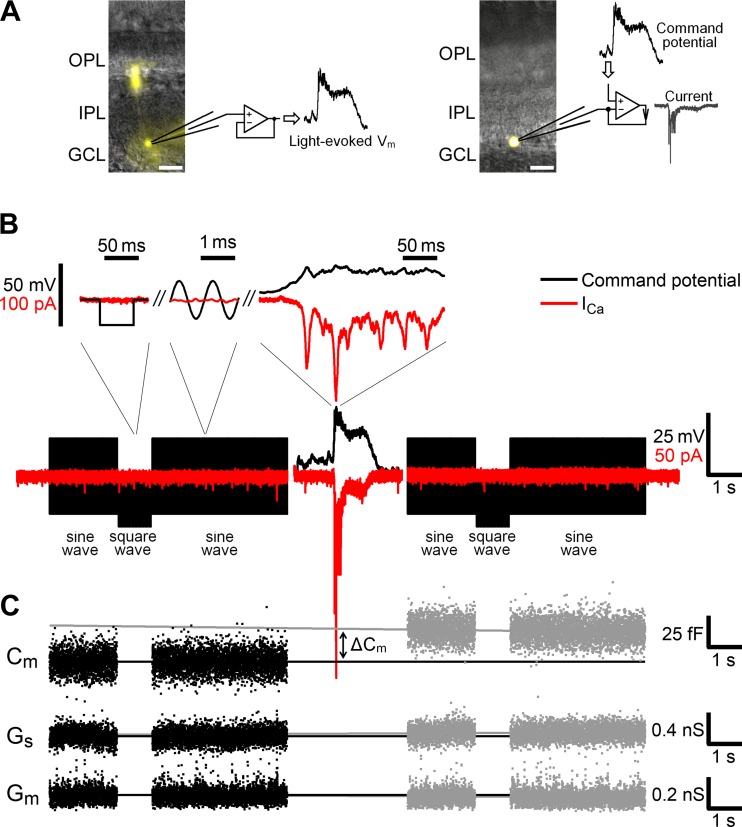
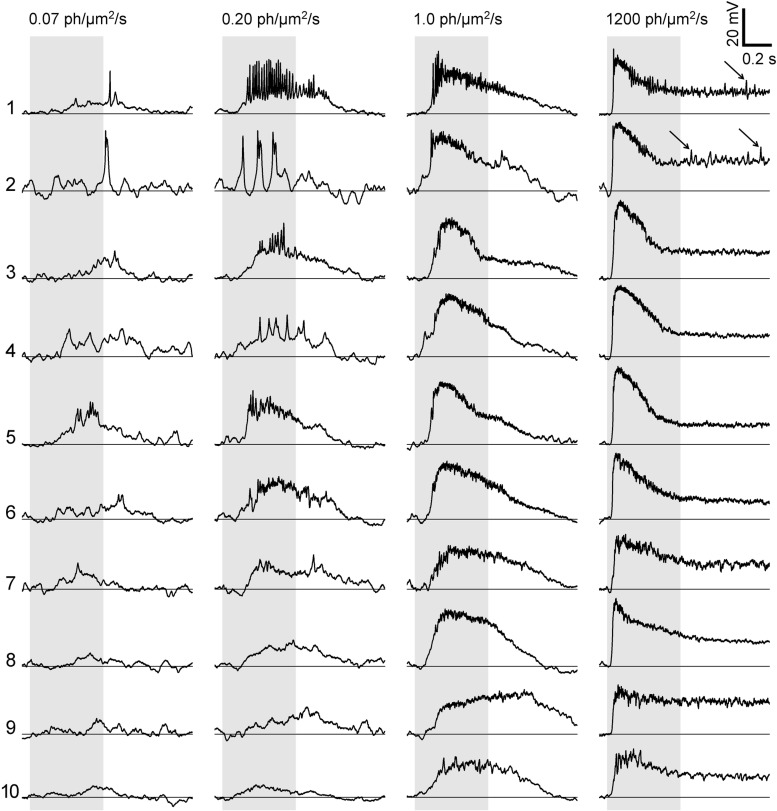
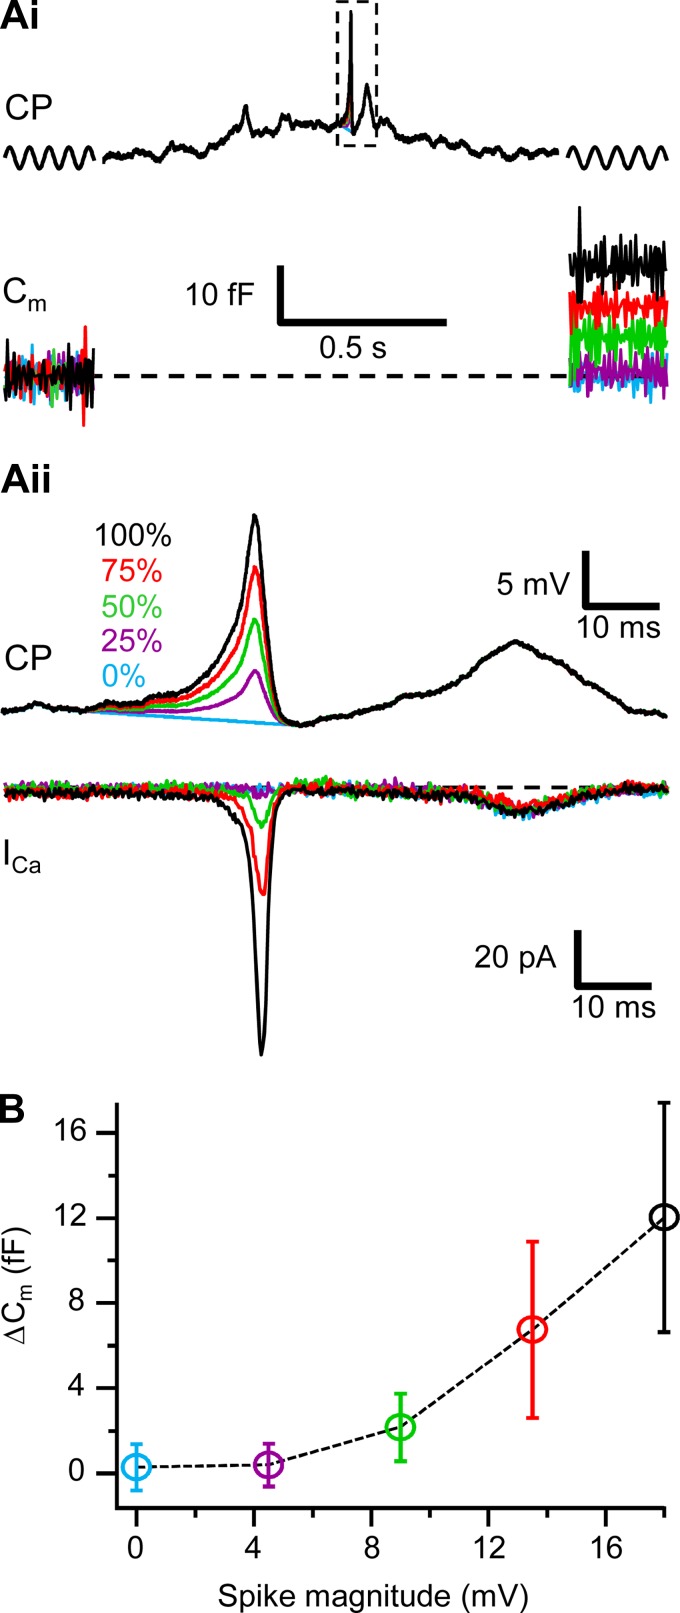
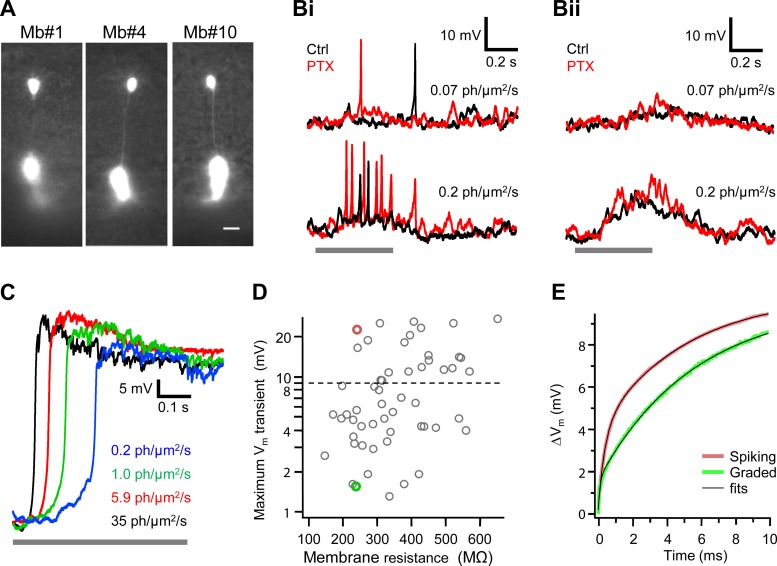
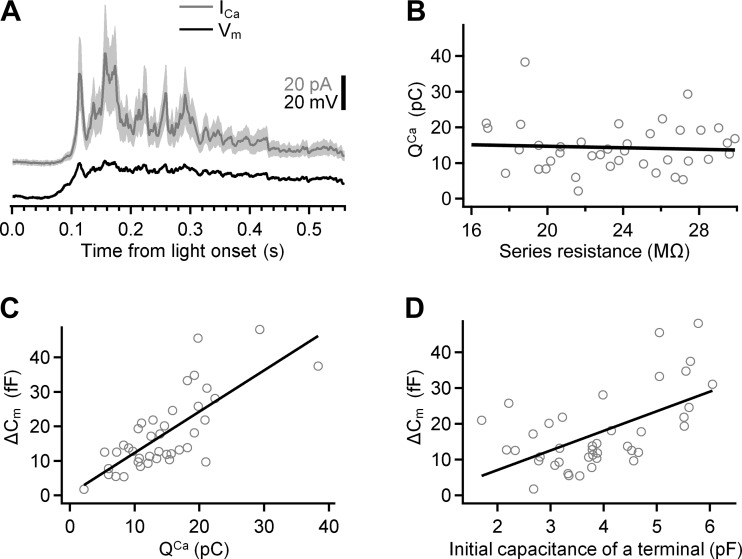
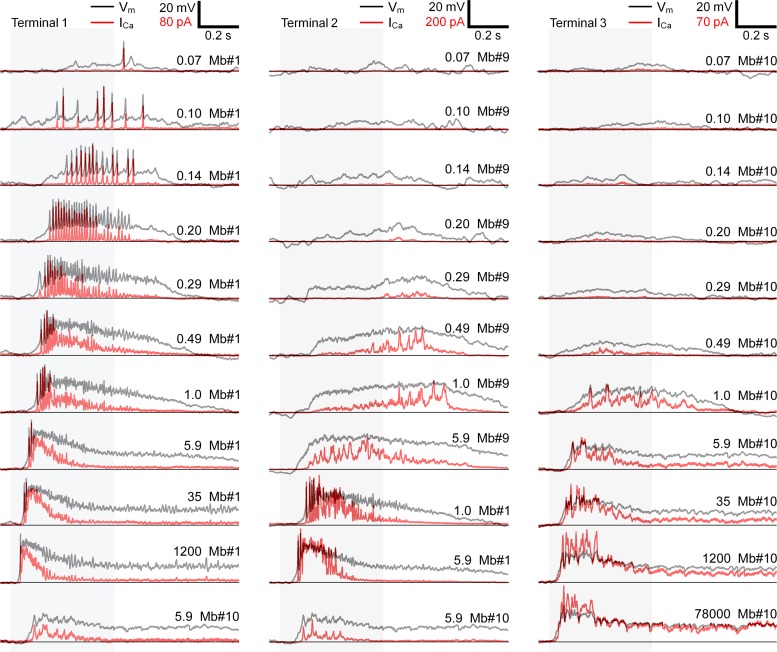
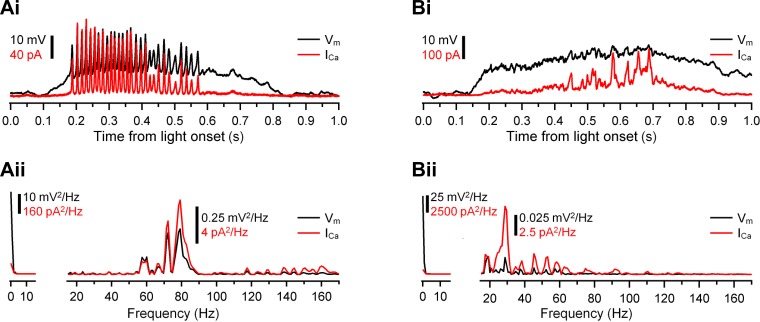
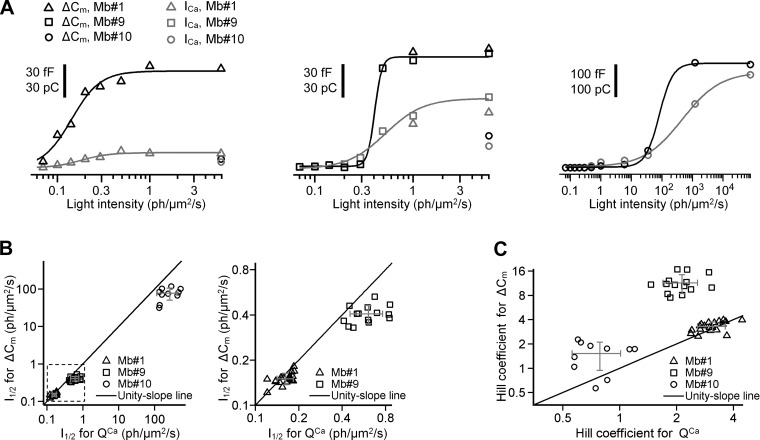
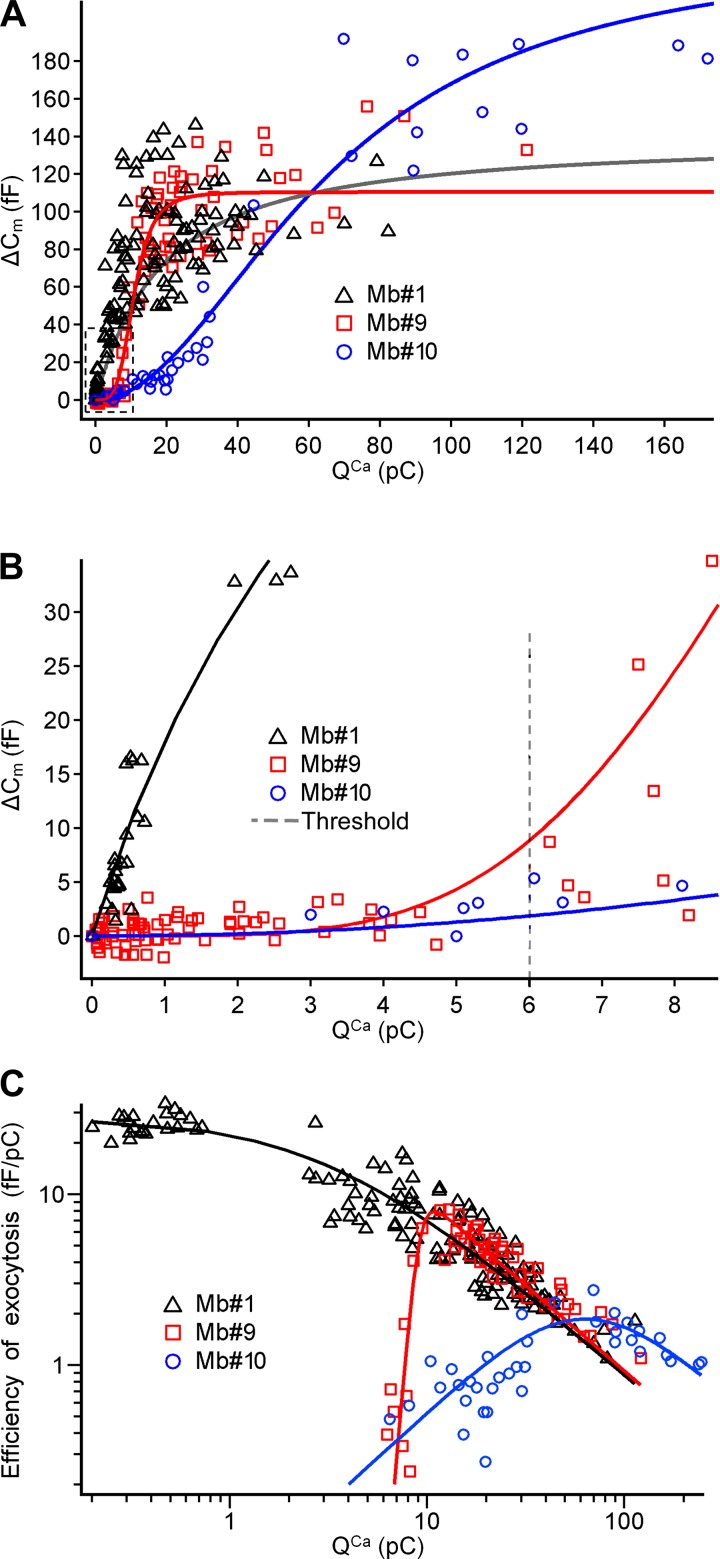
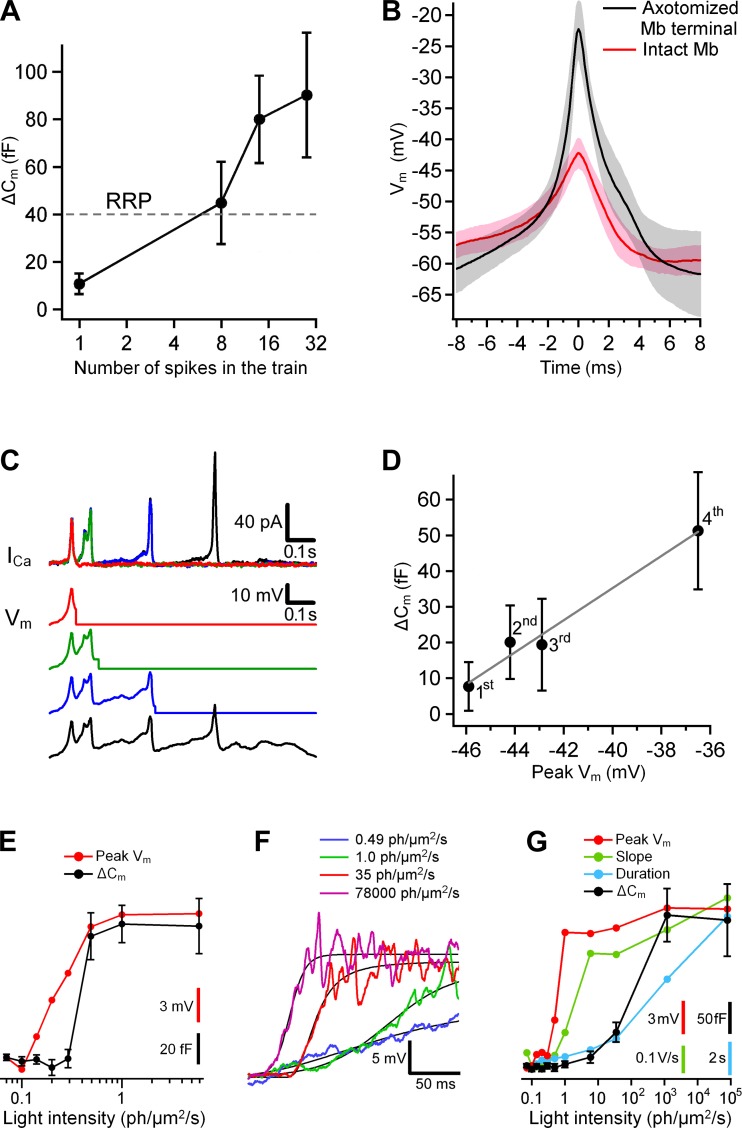
Most retinal bipolar cells (BCs) transmit visual input from photoreceptors to ganglion cells using graded potentials, but some also generate calcium or sodium spikes. Sodium spikes are thought to increase temporal precision of light-evoked BC signaling; however, the role of calcium spikes in BCs is not fully understood. Here we studied how calcium spikes and graded responses mediate neurotransmitter release from Mb-type BCs, known to produce both. In dark-adapted goldfish retinal slices, light induced spikes in 40% of the axon terminals of intact Mbs; in the rest, light generated graded responses. These light-evoked membrane potentials were used to depolarize axotomized Mb terminals where depolarization-evoked calcium current (ICa) and consequent exocytosis-associated membrane capacitance increases (ΔCm) could be precisely measured. When evoked by identical dim light intensities, spiking responses transferred more calcium (Q(Ca)) and triggered larger exocytosis with higher efficiency (ΔCm/Q(Ca)) than graded potentials. Q(Ca) was translated into exocytosis linearly when transferred with spikes and supralinearly when transferred with graded responses. At the Mb output (ΔCm), spiking responses coded light intensity with numbers and amplitude whereas graded responses coded with amplitude, duration, and steepness. Importantly, spiking responses saturated exocytosis within scotopic range but graded potentials did not. We propose that calcium spikes in Mbs increase signal input-output ratio by boosting Mb glutamate release at threshold intensities. Therefore, spiking Mb responses are suitable to transfer low-light-intensity signals to ganglion cells with higher gain, whereas graded potentials signal for light over a wider range of intensities at the Mb output.

Keywords: bipolar cell; calcium spike; graded potential; light response; threshold.


Figures

Fig. 1.
Fig. 1.
Experimental procedure. A: a light-evoked membrane potential (Vm) was recorded from an axon terminal of an intact Mb in current-clamp mode (left) and injected as a command potential into an axotomized terminal of another Mb in voltage-clamp mode (right). Alexa Fluor 488-filled Mbs (yellow) were imaged at the end of experiments. IPL, inner plexiform layer; OPL, outer plexiform layer; GCL, ganglion cell layer. Scale bars, 20 μm. B, bottom: injected light-evoked Vm (black, center) was flanked by sequences of sine and square waves. Top: the calculated Ca2+ current (ICa, red) in response to injected Vm (black) is shown on a fine timescale. Note that the ICa was noticeable when induced with light-evoked Vm but not with sine or square waves. C: trends of the membrane capacitance (Cm) before (black) and after (gray) injection of a light-evoked Vm were linearly extrapolated, and the difference in ΔCm at the peak magnitude of the ICa represented exocytosis. Trends of the series conductance (Gs, middle) and membrane conductance (Gm, bottom) were analyzed similarly.
Fig. 2.
Fig. 2.
Light responses of Mb-type bipolar cells in dark-adapted retinas varied from spiking to graded. Vm in response to 500-ms-long light stimuli (shaded) recorded from axon terminals are shown for 10 representative Mbs. Light intensities (0.07, 0.20, 1.0, and 1,200 photons·μm−2·s−1) are shown at top. The Mbs' ID numbers (1–10) are shown on left. Light responses with voltage transients >9 mV were considered as spiking (Mb1–Mb7) and those with transients ≤9 mV as graded (Mb8–Mb10). Arrows point to small voltage transients during plateau phase of the light response (Mb1 and Mb10, 1,200 photons·μm−2·s−1).
Fig. 3.
Fig. 3.
Determining the functionally relevant spike magnitude. Ai, top: a light-evoked response with spike downscaled to 75%, 50%, 25%, and 0% of its original magnitude (dashed box, shown in detail in Aii), flanked with sine waves (shown schematically) was injected as a command potential (CP) into axotomized Mb terminals. Bottom: the exocytosis triggered in axotomized Mb terminals by the command potentials shown at top. Capacitance traces were averaged over 10 samples for better visibility. Noticeable exocytosis was triggered by the spike downscaled to 50% of its magnitude (green) but not with spikes downscaled to 25% (purple) or 0% (blue). Aii, top: expanded command potentials from dashed box shown in Ai. Bottom: ICa induced in axotomized Mb terminals by the command potentials shown at top. Note that the noticeable ICa is induced with spike downscaled to 50% (green) but not to 25% (purple) or 0% (blue). B: exocytosis triggered with the downscaled spikes (shown in Ai) in axotomized Mb terminals (n = 7). Note that noticeable exocytosis is triggered with spike with magnitude downscaled to 50% (green) but not 25% (purple) or 0% (blue).
Fig. 4.
Fig. 4.
Mb-type bipolar cells with spiking and graded responses. A: superimposed fluorescent and infrared images of Mb-generated spiking (Mb1 and Mb4) and graded (Mb10) responses shown in Fig. 2. Scale bar, 10 μm. Note the similarity in morphology of Mb-generated spiking and graded responses. Bi and Bii: responses of Mb with spiking (Bi) and graded (Bii) membrane voltage (Vm) to light with intensities of 0.07 photons·μm−2·s−1 (top) and 0.2 photons·μm−2·s−1 (bottom) in control Ames medium (Ctrl, black) and in the presence of 100 μM picrotoxin (PTX, red). Note that although PTX potentiated light-evoked responses, it did not turn spiking into graded (Bi) or graded into spiking (Bii) Vm. C: Mb light responses with cesium-based internal solution in current-clamp mode. Under the block of potassium channels with Cs+ and TEA, Mbs responded to light with nonspiking sustained depolarization up to −9.7 ± 9.9 mV (n = 7) with duration exceeding that of the light stimulus applied between 0 and 0.5 s. D: maximum magnitude of light-evoked Vm transient weakly correlated with Mb membrane resistance at command voltage −60 mV (Pearson's correlation coefficient 0.34 ± 0.13). Horizontal dashed line shows 9 mV threshold for spiking potentials. The input resistance of the dark-adapted Mbs was 365 ± 140 MΩ (n = 55), similar to ∼444 MΩ measured at the soma by Protti et al. (2000). Red and green circles represent Mbs selected for further analysis shown in E. E: mean response (n = 20) to a current step (42 pA) of 2 Mbs with the same input resistance but generating different maximum light-evoked Vm transients: 22.5 mV (red) and 1.54 mV (green). Note that the Vm depolarization was consistently larger for the Mb generating spiking responses (red), reaching the maximal difference of 2 mV at 1.6 ms after current onset. Black traces show double-exponential fits. Based on the fit parameters, capacitances of the axon terminals of Mbs with spiking and graded responses were similar, 3.3 ± 0.1 pF vs. 3.1 ± 0.2 pF, whereas the axon resistance was larger for the Mb with spiking responses, 87.6 ± 0.5 MΩ vs. 36.0 ± 1.9 MΩ.
Fig. 5.
Fig. 5.
Variability in ICa and exocytosis in axotomized Mb terminals. A: mean ICa (gray) in response to injection of a light-evoked Vm (black) into axotomized Mb terminals (n = 40). The shaded region around the mean shows ±SD. The polarity of the inward ICa was reversed for easier side-by-side comparison with the Vm. The Vm was recorded from axon terminal of Mb10 in response to light with intensity of 5.9 photons·μm−2·s−1. The ratio of the mean ICa to its SD for the duration of the response was 2.1 ± 0.2. B: the transferred Ca2+ charge (QCa) did not correlate with the series resistance: the Pearson's correlation coefficient was −0.06 ± 0.16. C: the exocytosis (ΔCm) strongly correlated with QCa: the slope of the linear fit (black) was 1.20 ± 0.17 fF/pC; the Pearson's correlation coefficient was 0.75 ± 0.11. D: the exocytosis (ΔCm) strongly correlated with the initial capacitance of axotomized terminals: the slope of the linear fit (black) was 5.5 ± 1.3 fF/pF; the Pearson's correlation coefficient was 0.56 ± 0.14.
Fig. 6.
Fig. 6.
ICa of representative axotomized Mb terminals triggered by injection of light-evoked Vm changes. Light intensity corresponding to the shaded areas (in photons·μm−2·s−1) and Mbs' ID numbers are shown at top right of each Vm trace (black). The polarity of the inward ICa (red traces) was reversed for easier side-by-side comparison with the corresponding Vm. Terminal 1 (left) was tested with spiking responses of Mb1 (see Fig. 2) to light with intensities of 0.07–1,200 photons·μm−2·s−1 and with graded response of Mb10 to light with intensity of 5.9 photons·μm−2·s−1. Terminal 2 (center) was tested with graded responses of Mb9 to light with intensities of 0.07–5.9 photons·μm−2·s−1, 2 spiking responses of Mb1 to light with intensities of 1.0 and 5.9 photons·μm−2·s−1, and graded response of Mb10 to light with intensity of 5.9 photons·μm−2·s−1. Terminal 3 (right) was tested with graded responses of Mb10 to light with intensities of 0.07–78,000 photons·μm−2·s−1. Horizontal black lines show zero baseline for ICa and resting potential −63 mV for Vm.
Fig. 7.
Fig. 7.
Ca2+ channels act as a high-pass filter of light-evoked Vm changes. Ai and Bi: Ca2+ transients (ICa, red) induced by injection of spiking (Ai) and graded (Bi) light-evoked Vm (black) into axotomized Mb terminals. Traces were reproduced from Fig. 6: Mb1 at 0.20 photons·μm−2·s−1 (Ai) and Mb9 at 0.49 photons·μm−2·s−1 (Bi). Note that ICa barely follows the sustained potentials. Aii and Bii: power spectrum of the Vm (black) and ICa (red) shown in Ai and Bi fell into 2 distinctly separated frequency bands: 0–16 Hz and 16–170 Hz. The 0–16 Hz band contained low-frequency components, whereas the 16–170 Hz band contained frequencies of the spike train (Aii) and Vm oscillations on top of graded potential (Bii). The normalized power of ICa was greater than that of Vm: 41.3 ± 0.5% vs. 6.4% (P = 0.001, n = 19) for the spiking response and 7.5 ± 0.7% vs. 0.2% (P = 0.02, n = 18) for the graded response.
Fig. 8.
Fig. 8.
Exocytosis and Ca2+ influx triggered by light-evoked potentials. A: ΔCm (black) and QCa (gray) triggered by light-evoked potentials in axotomized Mb terminals 1 (left), 2 (center), and 3 (right). The initial capacitance of axotomized Mb terminals 1, 2, and 3 was 3.29, 4.38, and 2.71 pF, respectively. Fit was done with the Hill equation. For ΔCm, the intensity at half-maximal response (I1/2, in photons·μm−2·s−1) was 0.15 ± 0.01 for spiking potentials from Mb1, 0.41 ± 0.02 for graded potentials from Mb9, and 82 ± 25 for graded potentials from Mb10, whereas the Hill coefficients were 2.79 ± 0.50, 11.7 ± 2.9, and 1.9 ± 0.7, respectively. For QCa, I1/2 (in photons·μm−2·s−1) was 0.18 ± 0.02 for spiking potentials from Mb1, 0.52 ± 0.06 for graded potentials from Mb9, and 462 ± 70 for graded potentials from Mb10, whereas the Hill coefficients were 2.89 ± 0.83, 2.25 ± 0.50, and 0.70 ± 0.06, respectively. Note that spiking light-evoked potentials from Mb1 and the most light-sensitive graded potentials from Mb9 almost saturated exocytosis at similar level (∼90 fF) at similar light intensity (0.49 photons·μm−2·s−1). B, left: I1/2 (in photons·μm−2·s−1) for ΔCm vs. that of for QCa. Right: expanded area inside the dashed box shown on left. Note that for spiking potentials mean values of I1/2 for ΔCm and QCa were almost equal (P = 0.1). For graded potentials mean value of I1/2 for ΔCm was less than that of for QCa. C: Hill coefficient for ΔCm vs. that for QCa. Note that for spiking potentials mean values of the Hill coefficient for ΔCm and QCa were not significantly different (P = 0.1). For graded potentials, the mean value of the Hill coefficient for the ΔCm was greater than that for the QCa (P = 10−7 for Mb10 and P = 0.05 for Mb10). Gray error bars in B and C show SD about the mean.
Fig. 9.
Fig. 9.
Exocytosis triggered by Ca2+ influx in response command potentials generated from light responses. A: ΔCm triggered in axotomized Mb terminals by QCa transferred with light-evoked potentials recorded at axon terminals of Mb1 (black), Mb9 (red), and Mb10 (blue). Fits were done with the Hill equation. Hill coefficients were 0.95 ± 0.19, 4.14 ± 0.52, and 2.02 ± 0.17 for Mb1, Mb9, and Mb10, respectively. I1/2s were 6.2 ± 1.8, 10.8 ± 0.4, and 65.9 ± 5.4 pC for Mb1, Mb9, and Mb10, respectively. B: expanded region shown in dashed box in A. Vertical dashed line marks the threshold for QCa transferred with graded potentials. Note that below this threshold the QCa transferred with spikes triggered exocytosis, whereas that transferred with graded potentials did not. C: efficiency of the exocytosis for Mb1 (black), Mb9 (red), and Mb10 (blue) as a ratio of ΔCm to QCa using the Hill fits from A. For spiking potentials from Mb1, exocytosis was the most efficient when triggered with QCa of 0.34 ± 0.08 pC transferred with a single spike. For graded potentials from Mb9 and Mb10, exocytosis was the most efficient when triggered with QCa of 14.3 ± 1.9 and 66.7 ± 7.9 pC, respectively.
Fig. 10.
Fig. 10.
Features of light-evoked spiking and graded Mb responses that affect exocytosis. A: the ΔCm triggered with light-evoked spike trains in axotomized terminals increased with the rise in the number of spikes in the trains: 10.8 ± 4.3 fF (1 spike) < 44.9 ± 17.3 fF (8 spikes) < 80.0 ± 18.4 fF (14 spikes) < 90.2 ± 26.1 fF (28 spikes); P ≤0.05 for each pair of means (Newman-Keuls test, n = 19). Horizontal dashed line shows the approximate size of the rapidly releasable pool (RRP). B: the 1st spike in a train induced by current injection in axotomized terminals (n = 10, black) and evoked by light in terminals of intact Mbs (n = 10, red). Shaded areas are within SD about means. C, bottom: the cuts of a light-evoked spike train recorded from an intact Mb. The cut of the 1st spike (red) overlies the cut of the 1st and 2nd spikes (green), which overlies the cut of the 1st, 2nd, and 3rd spikes (blue), which in turn overlies the cut of all 4 spikes in the train (black). Top: ICa in a representative axotomized Mb terminal in response to the cuts of the spike train shown below. D: the exocytosis per spike (black) triggered in axotomized Mb terminals (n = 16) vs. the amplitude of a spike in a train shown in C. The spikes' ordinal numbers are shown at the data points. The slope of the linear fit (gray) is 4.50 ± 0.48 fF/mV. E: the exocytosis (black) triggered in axotomized Mb terminals (n = 18) by the graded light-evoked potentials from Mb9 (see Fig. 6). Peak amplitude of the light-evoked potentials and its scale bar are shown in red. F: the rising phase of the graded potentials from Mb10 evoked by light with intensities of 0.49 (blue), 1.0 (green), 35 (red), and 78,000 (magenta) photons·μm−2·s−1. The fits (black) were done with the Hill equation. G: the exocytosis (black) triggered in axotomized Mb terminals (n = 10) by the graded light-evoked potentials from Mb10 (see Fig. 6). Peak amplitude of the light-evoked potentials and its scale bar are shown in red. The maximum slope of the potentials (from the Hill's fit) and its scale bar are shown in green. The duration of the light responses (above the threshold for ICa of −55 mV) and its scale bar are shown in blue.

Similar articles

Cited by

References

    1. Adler EM, Augustine GJ, Duffy SN, Charlton MP. Alien intracellular calcium chelators attenuate neurotransmitter release at the squid giant synapse. J Neurosci 11: 1496–1507, 1991. - PMC - PubMed
    1. Arman AC, Sampath AP. Dark-adapted response threshold of OFF ganglion cells is not set by OFF bipolar cells in the mouse retina. J Neurophysiol 107: 2649–2659, 2012. - PMC - PubMed
    1. Armstrong CM, Bezanilla F. Charge movement associated with the opening and closing of the activation gates of the Na channels. J Gen Physiol 63: 533–552, 1974. - PMC - PubMed
    1. Baden T, Berens P, Bethge M, Euler T. Spikes in mammalian bipolar cells support temporal layering of the inner retina. Curr Biol 23: 48–52, 2013a. - PubMed
    1. Baden T, Esposti F, Nikolaev A, Lagnado L. Spikes in retinal bipolar cells phase-lock to visual stimuli with millisecond precision. Curr Biol 21: 1859–1869, 2011. - PMC - PubMed

Publication types

LinkOut - more resources