. 2014 Oct 22;34(43):14304-17.
doi: 10.1523/JNEUROSCI.0930-14.2014.

Loss of mitochondrial fission depletes axonal mitochondria in midbrain dopamine neurons

Affiliations

Loss of mitochondrial fission depletes axonal mitochondria in midbrain dopamine neurons

Amandine Berthet et al. J Neurosci. .

Abstract

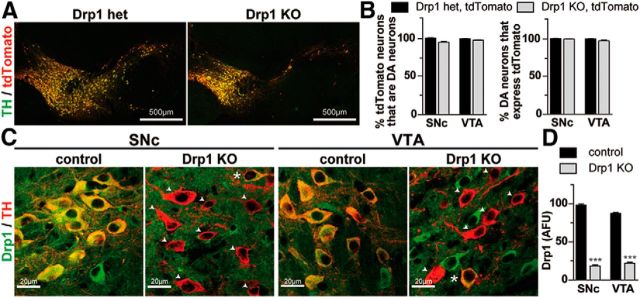
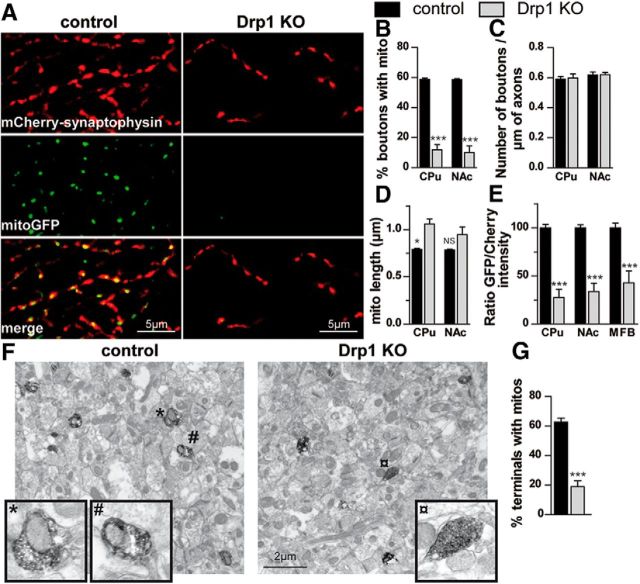
Disruptions in mitochondrial dynamics may contribute to the selective degeneration of dopamine (DA) neurons in Parkinson's disease (PD). However, little is known about the normal functions of mitochondrial dynamics in these neurons, especially in axons where degeneration begins, and this makes it difficult to understand the disease process. To study one aspect of mitochondrial dynamics-mitochondrial fission-in mouse DA neurons, we deleted the central fission protein dynamin-related protein 1 (Drp1). Drp1 loss rapidly eliminates the DA terminals in the caudate-putamen and causes cell bodies in the midbrain to degenerate and lose α-synuclein. Without Drp1, mitochondrial mass dramatically decreases, especially in axons, where the mitochondrial movement becomes uncoordinated. However, in the ventral tegmental area (VTA), a subset of midbrain DA neurons characterized by small hyperpolarization-activated cation currents (Ih) is spared, despite near complete loss of their axonal mitochondria. Drp1 is thus critical for targeting mitochondria to the nerve terminal, and a disruption in mitochondrial fission can contribute to the preferential death of nigrostriatal DA neurons.

Keywords: Drp1; Parkinson's disease; axon; mitochondria; neurodegeneration.


Figures

Figure 1.
Figure 1.
Loss of Drp1 in DA neurons leads to levodopa-responsive parkinsonism. A, Plot showing monthly weight measurements. Each point represents the average weight ± SEM (n = 4–101) for each genotype with the genders combined. B, Kaplan–Meier survival curve of control (n = 26), heterozygous (het; n = 18), and Drp1KO mice (n = 36). Drp1KO mice were significantly more likely to die than controls [HR 7.50, 95% CI: 2.82–19.9, p < 0.0001 by log-rank (Mantel–Cox) test]. C, Total ambulatory movements and rearing over the first 15 min after mice were placed in an open field cage was lower in Drp1KO (Daticre/wt, Drp1lox/lox; light gray column) than in Drp1 heterozygotes (Daticre/wt, Drp1lox/wt; dark gray) or controls (Datw/w, Drp1lox/lox or lox/wt; black; ***p < 0.001 vs controls at both time points). After mice were given levodopa (3 mg/kg) and retested 45 min later, the ambulatory movement of Drp1KO mice significantly increased (*p < 0.05; NS, not significant). The movement of controls probably decreased as a result of habituation. Data show mean ± SEM, n = 7–13 mice per group.
Figure 2.
Figure 2.
Loss of Drp1 promotes preferential death of nigrostriatal DA neurons, beginning at the nerve terminal. A, TH staining of brain sections from control and Drp1KO mice. Left, Striatal terminals from 1-month-old mice are almost completely lost in the CPu, but fibers projecting to the NAc are well preserved, and fibers in the OT are partially preserved. Right, DA neuron cell bodies from 2.5-month-old mice in the SNc and VTA are lost in both areas, but a subset of VTA neurons enriched in the ventromedial VTA are preserved. Scale bar, 500 μm. B, Quantitation of TH fiber loss by optical density reveals the early loss of fibers projecting to the CPu from age P7 with near complete denervation by P14. Fibers projecting to the NAc shell are largely preserved, and fibers to the NAc core and OT are partially preserved through 2.5 months. Data show mean ± SEM; *p < 0.05, **p < 0.01, ***p < 0.001 versus respective control group by two-way ANOVA and Bonferroni post hoc test; n = 3–4 mice with 6–19 fields per mouse. C, HPLC of CPu dissected from fresh-frozen brain tissue from 1-month-old mice reveals complete loss of DA in Drp1KO mice, ***p < 0.001 by one-way ANOVA with Tukey post hoc test, n = 4 mice per group. D, Stereology shows severe loss of DA neurons in both the SNc and VTA. Data show mean ± SEM; **p < 0.01, ***p < 0.001 versus respective control group, n = 3–4 mice per group by two-way ANOVA and Bonferroni post hoc test. E, Fluorogold was injected into the NAc of 4-month-old control and Drp1KO mice 4 d before perfusion. Double staining against TH and Fluorogold shows that surviving NA fibers originate from DA neurons in the ventromedial VTA. Scale bars: 200 μm; inset, 10 μm.
Figure 3.
Figure 3.
Midbrain DA neurons in Drp1KO animals express Cre and lose Drp1. A, One-month-old Drp1KO-tdTomato-DATcre (Drp1lox/lox;tdTomatolox/wt;DATcre/wt) and tdTomato-DATcre control (tdTomatolox/wt;DATcre/wt) brains were processed for immunostaining against TH (to identify DA neurons) and tdTomato (as a surrogate for cre expression). Scale bar, 500 μm. B, Quantitation reveals that the vast majority of TH+ cell bodies are tdTomato+, indicating that essentially all DA neurons in the SN and VTA express Cre. Similarly, almost all tdTomato+ neurons are TH+, indicating that there is essentially no ectopic expression of Cre in non-DA neurons. Data show mean ± SEM, N = 3–4 mice per group, 84–590 cells per group. C, Midbrain sections from P14 Drp1KO-tdTomato-DATcre and tdTomato-DATcre mice were immunostained against Drp1 and tdTomato, and the intensity of Drp1 staining quantified on a cell-by-cell basis. Drp1 fluorescence was markedly decreased in DA neurons in both the SNc and VTA (arrowheads), although occasional neurons in both regions (stars) showed preservation of Drp1. Scale bar, 20 μm. D, Quantitation of mean Drp1 staining intensity in Drp1KO versus control cell bodies; ***p < 0.001 versus respective control region by unpaired two-tailed t test. Data show mean ± SEM, n = 4 mice per group, 56–126 cells per mouse.
Figure 4.
Figure 4.
Adult DA neurons require Drp1 for survival. AAV-cre was delivered to the SNc of 3-month-old tdTomatolox/lox and Drp1lox/lox, tdTomatolox/lox mice. A, At 2.5 months later, TH immunohistochemistry revealed severe loss of midbrain DA neurons in the SNc and VTA of Drp1KO mice. Drp1KO also produced near complete loss of terminals in the CPu, although some fibers projecting to the NAc were again spared. Scale bar, 500 μm. B, tdTomato immunohistochemistry confirms Cre expression in residual TH+ fibers in the NAc. C, Quantitation of TH optical density in the striatum. Mice receiving AAV-cre had markedly decreased TH density in all regions examined (p < 0.0001 vs respective control region by one-way ANOVA with Bonferroni post hoc test). However, the residual optical density was significantly higher in the NAc shell than in the CPu (**p < 0.01), indicating that fibers projecting to the NAc shell were relatively spared. NAc core and OT also had a trend to greater residual optical density, but this did not reach significance versus CPu. Data show mean ± SEM, n = 4–7 mice per group.
Figure 5.
Figure 5.
Loss of Drp1 depletes mitochondria from axons. A–E, AAVs expressing mitochondria-targeted GFP (mitoGFP; green, to visualize mitochondria) and mCherrySynaptophysin (red, to visualize synaptic boutons) in DIO constructs (Sohal et al., 2009) that express only in Cre-expressing neurons were coinjected into the SNc of 21-d-old DATcre control and Drp1KO-DATcre mice. One month later, ∼60% of control synaptic boutons show mitochondria in the CPu and NAc. In contrast, remaining Drp1KO synapses in the CPu and NAc contain very few mitochondria, despite having normal numbers of boutons per length of axon. Scale bars, 5 μm. Data show mean ± SEM; *p < 0.05, ***p < 0.001 versus respective control group by one-way ANOVA and Tukey post hoc test; n = 4 mice per group, where each value is the mean of 8–20 fields. E, Images from regions of interest—the CPu, NAc, and the MFB—were also quantified based on the ratio of total GFP/mCherry fluorescence to approximate the ratio of total mitochondria/total axons. ***p < 0.001 versus indicated group; n = 5 mice per group, where each value is the mean of 2–8 fields. F, G, Immuno-EM of NAc, stained against TH to identify DA terminals show that 60% TH-positive boutons contain mitochondria in the NAc of control mice and only 20% of those in Drp1KO contain mitochondria. *, #, and ¤ mark boutons in inset. ***p < 0.001 by unpaired two-tailed t test, n = 4 mice per group, 17–41 terminals per mouse. Scale bar, 2 μm.
Figure 6.
Figure 6.
Loss of Drp1 disrupts mitochondrial morphology and decreases mitochondrial mass in DA neurons. A–F, Mitochondrial morphology and mass in midbrain DA neurons from 1-month-old Drp1KO and control mice. A, Loss of Drp1 causes mitochondria to become visibly swollen in most midbrain DA neurons (identified by TH staining, red). B, Mitochondrial mass decreased upon determining the mean fluorescence (normalized to cell area) of neurons stained with Tom20 (C), AAVmitoGFP (AFU, arbitrary fluorescent units) (D), PDH (E), and cytochrome c oxidase I (Cox I; F). Scale bars: 5 μm. Data show mean ± SEM, *p < 0.05, **p < 0.001, ***p < 0.001 by unpaired two-tailed t test, n = 3–4 mice per group, 36–76 cells quantified per mouse. G, H, Ultrastructural analysis at the cell body by immunogold staining against TH revealed larger mitochondria in Drp1KO mice than in controls. Scale bars: 1 μm. Data show mean ± SEM, n = 3 mice per group, 11–16 cell bodies quantified per mouse.
Figure 7.
Figure 7.
Loss of Drp1 inhibits mitochondrial mobility in axons. A, B, Depletion of Drp1 in hippocampal neurons produces long mitochondria with normal widths (mitoGFP) in axons (mCherrySynatophysin). Loss of Drp1 markedly decreases the percentage of moving mitochondria. There is also a trend for decreased mean velocity of movement, as depicted on kymographs. Scale bar, 10 μm. C, There was no difference in the length of moving and stationary Drp1KO mitochondria. D, In contrast to controls, Drp1KO mitochondria often showed extension–retraction movements, where one or both sides moved without any net movement of the mitochondria [uncoordinated (unc) movements]). E, These were more frequent on the retrograde side. F, G, Treatment with the calcium ionophore calcimycin (1 μm) decreases net movement of control mitochondria, but does not block the uncoordinated movements of Drp1KO mitochondria. Data show mean ± SEM, *p < 0.05, **p < 0.001, ***p < 0.001 by unpaired two-tailed t test (A–D, F, G) or one-way ANOVA and Tukey post hoc test (E), n = 16–48 fields per group, from 2—4 experiments.
Figure 8.
Figure 8.
Loss of Drp1 decreases mitochondrial membrane potential at the cell body. A, B, Drp1KO and control hippocampal neurons expressing mitoBFP were loaded with the membrane potential-sensitive dye TMRM (20 nm) for 1 h before imaging live. Selected on the basis of BFP, TMRM fluorescence was quantified in individual cells. At baseline, Drp1KO neurons had a lower mean TMRM fluorescence (normalized to the cytoplasmic area) that was not affected by the ATP synthase inhibitor oligomycin (5 μm), but markedly decreased by the proton ionophore FCCP (10 μm). Scale bar, 5 μm. Data show mean ± SEM, *p < 0.05 by two-way ANOVA, n = 5–9 fields (9–12 cells) per group, from two experiments. The experiment was repeated two additional times using a lower oligomycin dose (2.5 μm) with similar results. C, The percentage of the cytoplasmic area covered by TMRM+ mitochondria was decreased in Drp1KO neurons. D, In addition, the area of total mitochondria per cell assessed by Tom20 staining was also decreased. E, Drp1KO did not affect the mean fluorescence of the TMRM-labeled mitochondria themselves, indicating that the mitochondria in Drp1KO neurons had normal polarization. *p < 0.05, ***p < 0.001 by unpaired two-tailed t test, n = 22–26 cells per group (15–20 fields per group).
Figure 9.
Figure 9.
α-Synuclein levels are decreased in Drp1KO DA neurons. A, B, Two-week-old Drp1KO-tdTomato-DATcre and tdTomato-DATcre mice were perfused and then immunostained against α-synuclein and tdTomato, and the mean intensity of α-synuclein staining (normalized per cell) was quantified on a cell-by-cell basis. At 2 weeks, when DA terminals have degenerated in the CPu but most DA cell bodies remain in the midbrain, α-synuclein levels were markedly decreased in SNc but not in ventromedial VTA (VTAVM) DA neurons. Data show mean ± SEM, *p < 0.05 by unpaired two-tailed t test, n = 3 mice per group, 33–67 cell bodies quantified per mouse. Scale bar, 5 μm. C, By 9 months, α-synuclein levels had also decreased in surviving Drp1KO versus Drp1Het DA neurons in the VTAVM. Data show mean ± SEM, n = 2–3 mice per group, 25–50 cell bodies quantified per mouse.
Figure 10.
Figure 10.
Increased calbindin does not identify resistant Drp1KO DA neurons. A–C, Midbrain sections from 1-month-old Drp1KO-tdTomato-DATcre and tdTomato-DATcre mice were immunostained against calbindin and tdTomato, and the intensity of calbindin staining was quantified on a cell-by-cell basis. B, VTA DA neurons had higher mean calbindin than SNc DA neurons (AFU, arbitrary fluorescence units). However, surviving Drp1KO DA neurons had calbindin levels similar to controls in the VTA, and only slightly elevated in the SNc. Scatter graphs of calbindin levels in these same individual DA neurons reveal that many of the surviving Drp1KO DA neurons have low calbindin. C, tdTomato expression is similar between controls and Drp1KO, suggesting a similar capacity to synthesize protein. Data show mean ± SEM, *p < 0.05, ***p < 0.001 by one-way ANOVA and Tukey post hoc test, n = 4 mice per group, 6–12 fields, 374–2515 cell bodies quantified per mouse. Scale bars: A, 100 μm; inset, 10 μm.
Figure 11.
Figure 11.
Electrophysiological properties of the subpopulation(s) of resistant DA neurons. Whole-cell recordings were made in horizontal brain slices. DA and non-DA neurons were identified live based on the presence or absence of the tdTomato reporter, respectively, and confirmed post hoc by TH immunostaining. A, Anatomic locations of the recorded and recovered wild-type (blue) and knock-out (red) TH-positive cells (A, anterior; P, posterior; M, medial; L, lateral), which were scattered throughout the VTA, and occasionally in the SNc. SNr, substantia nigra pars reticulata; MT, medial terminal nucleus of the accessory optic tract; IPF, interpeduncular fossa. B, Firing rate of surviving Drp1KO DA neurons is similar to controls in the VTA and SN overall, although was markedly increased in three of the SNc neurons sampled. C, While all DA neurons in wild-type mice exhibited a detectable Ih (a hyperpolarization-activated nonselective cation current; closed circles, detectable; open, not detectable), almost all surviving DA neurons had very small or absent Ih. D, Surviving Drp1KO DA neurons also had smaller input resistance (Ri), consistent with their smaller size. E, AP durations were similar between DA neurons from wild-type (wt) and Drp1KO mice (ko). F, VTA DA neurons from Drp1KO mice had higher coefficients of variation of the CV-ISI than controls. G, Anatomic locations of the recorded and recovered TH-negative neurons, which were scattered throughout the VTA, with occasional cells in the SN. H, Non-DA neurons from both control and Drp1KO mice had very small Ih values. Some of the non-DA SNc neurons expressed larger than expected Ihs. I, J, Input resistances (Ri) and AP durations in both brain regions were overlapping between wild-type and Drp1KO samples. K, No differences were observed between the coefficient of variation of the CV-ISI of non-DA neurons in Drp1KO animals. *p < 0.05, **p < 0.01,***p < 0.001 by unpaired two-tailed t test. Horizontal lines show mean value for each group. Recordings were made in four Drp1KO mice and four wild-type mice. Scale bars: horizontal, 200 ms; vertical, 20 mV.

References

    1. Alexander C, Votruba M, Pesch UE, Thiselton DL, Mayer S, Moore A, Rodriguez M, Kellner U, Leo-Kottler B, Auburger G, Bhattacharya SS, Wissinger B. OPA1, encoding a dynamin-related GTPase, is mutated in autosomal dominant optic atrophy linked to chromosome 3q28. Nat Genet. 2000;26:211–215. doi: 10.1038/79944. - DOI - PubMed
    1. Arnoult D, Rismanchi N, Grodet A, Roberts RG, Seeburg DP, Estaquier J, Sheng M, Blackstone C. Bax/Bak-dependent release of DDP/TIMM8a promotes Drp1-mediated mitochondrial fission and mitoptosis during programmed cell death. Curr Biol. 2005;15:2112–2118. doi: 10.1016/j.cub.2005.10.041. - DOI - PubMed
    1. Bäckman CM, Malik N, Zhang Y, Shan L, Grinberg A, Hoffer BJ, Westphal H, Tomac AC. Characterization of a mouse strain expressing Cre recombinase from the 3′ untranslated region of the dopamine transporter locus. Genesis. 2006;44:383–390. doi: 10.1002/dvg.20228. - DOI - PubMed
    1. Berthet A, Porras G, Doudnikoff E, Stark H, Cador M, Bezard E, Bloch B. Pharmacological analysis demonstrates dramatic alteration of D1 dopamine receptor neuronal distribution in the rat analog of L-DOPA-induced dyskinesia. J Neurosci. 2009;29:4829–4835. doi: 10.1523/JNEUROSCI.5884-08.2009. - DOI - PMC - PubMed
    1. Betarbet R, Sherer TB, MacKenzie G, Garcia-Osuna M, Panov AV, Greenamyre JT. Chronic systemic pesticide exposure reproduces features of Parkinson's disease. Nat Neurosci. 2000;3:1301–1306. doi: 10.1038/81834. - DOI - PubMed

Publication types