. 2014 Oct 22;34(43):14349-64.
doi: 10.1523/JNEUROSCI.3492-14.2014.

Dopamine invigorates reward seeking by promoting cue-evoked excitation in the nucleus accumbens

Affiliations

Dopamine invigorates reward seeking by promoting cue-evoked excitation in the nucleus accumbens

Johann du Hoffmann et al. J Neurosci. .

Abstract

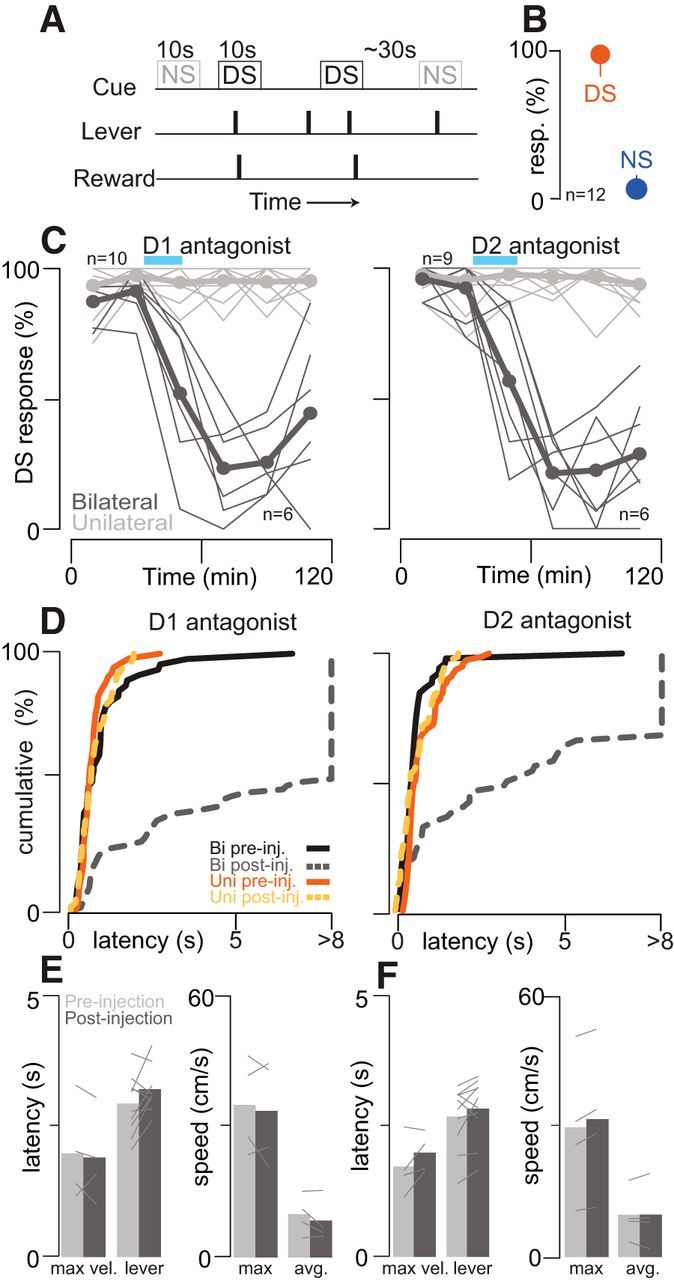
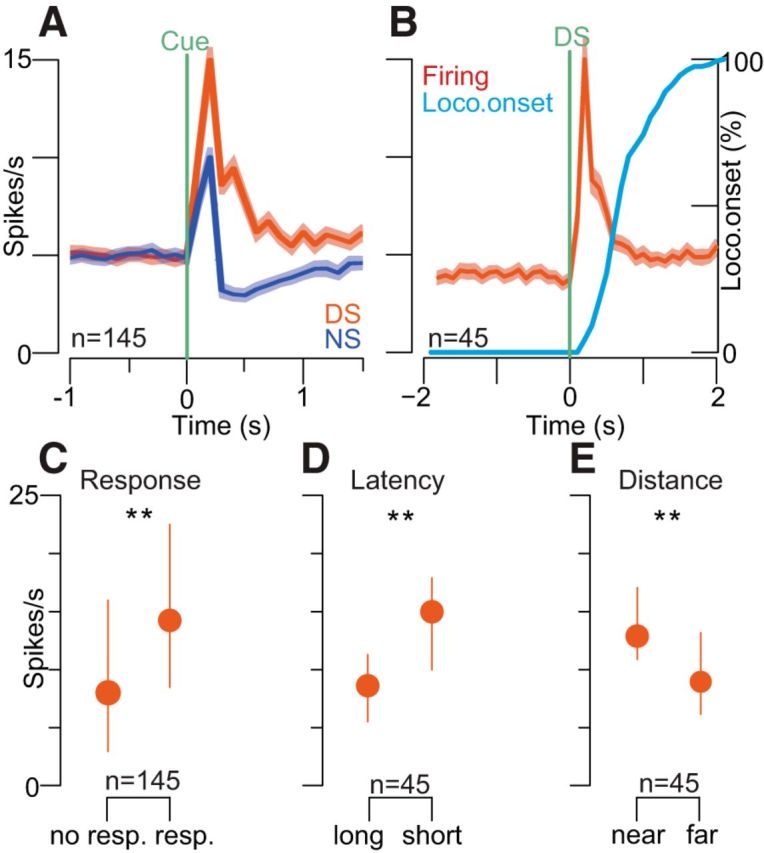
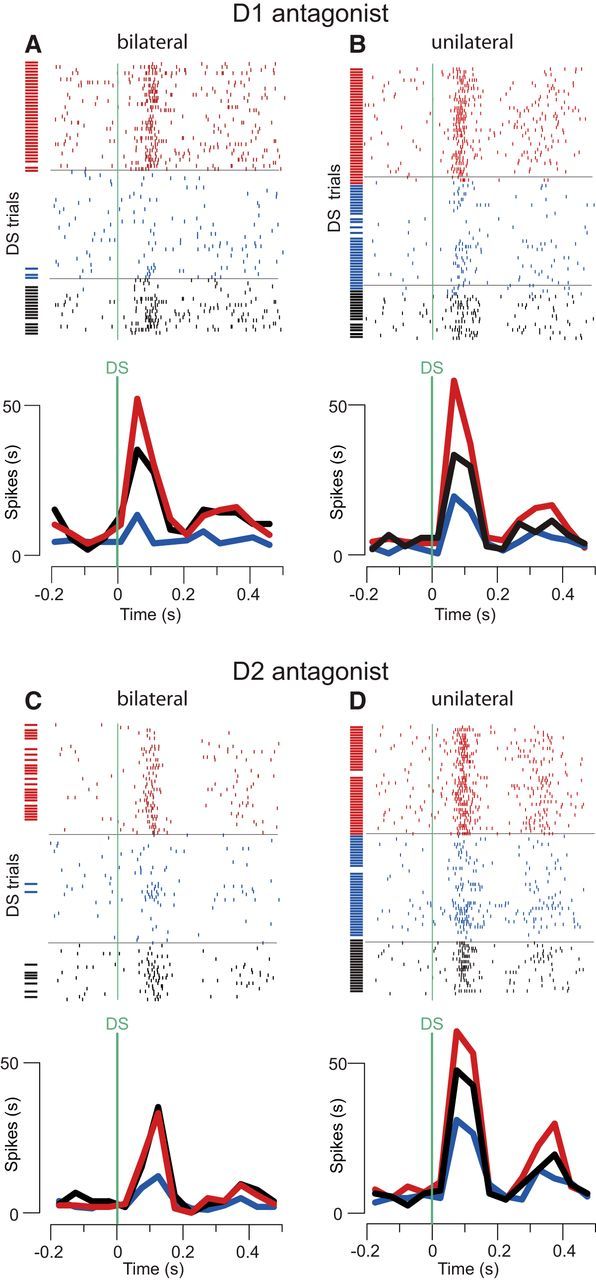
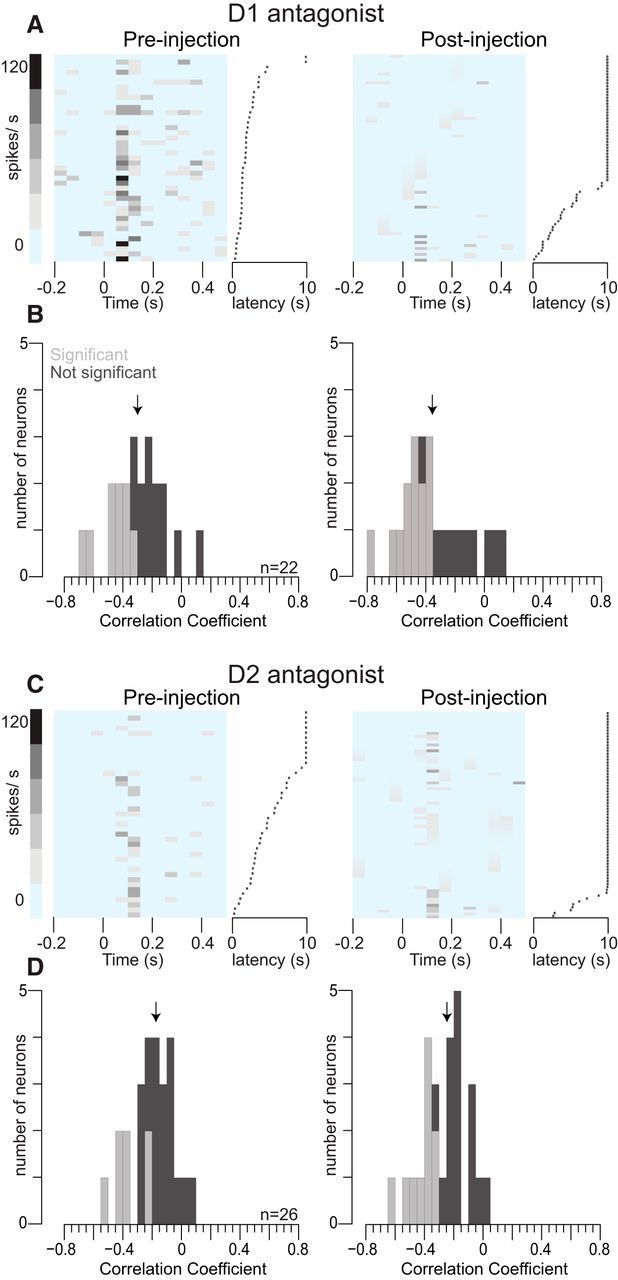
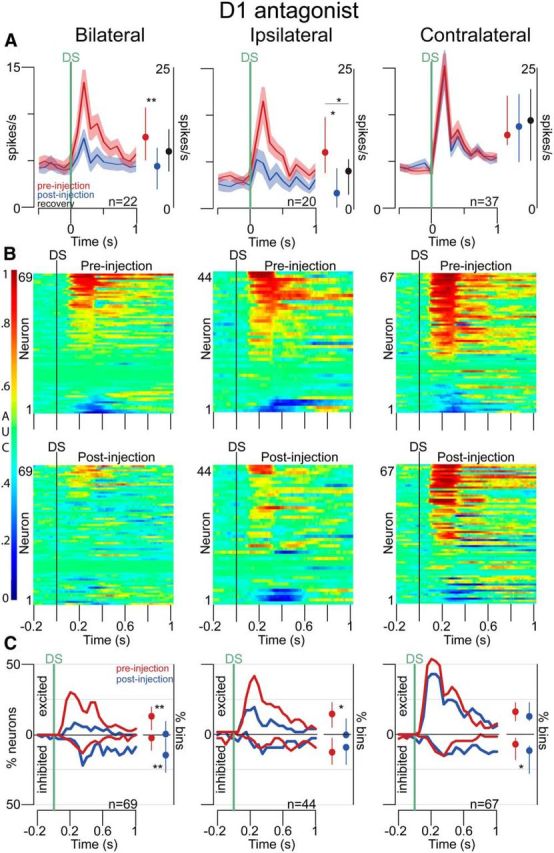
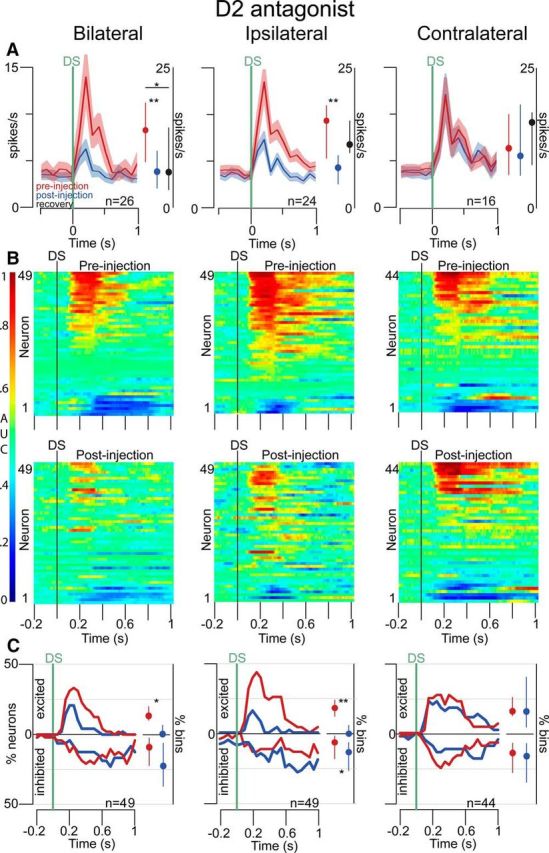
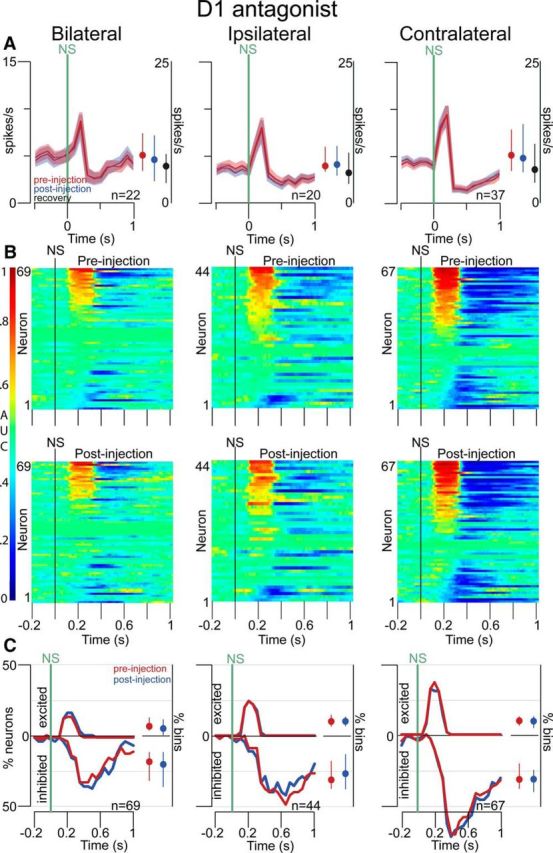
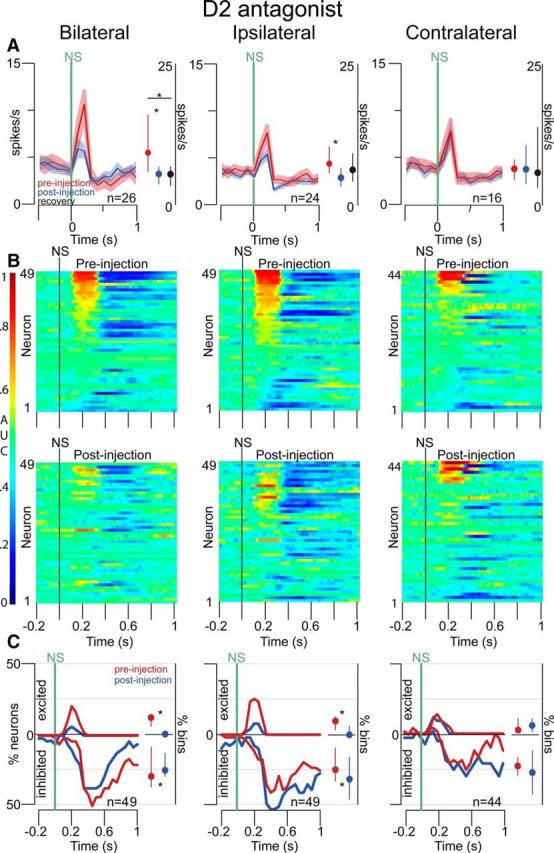
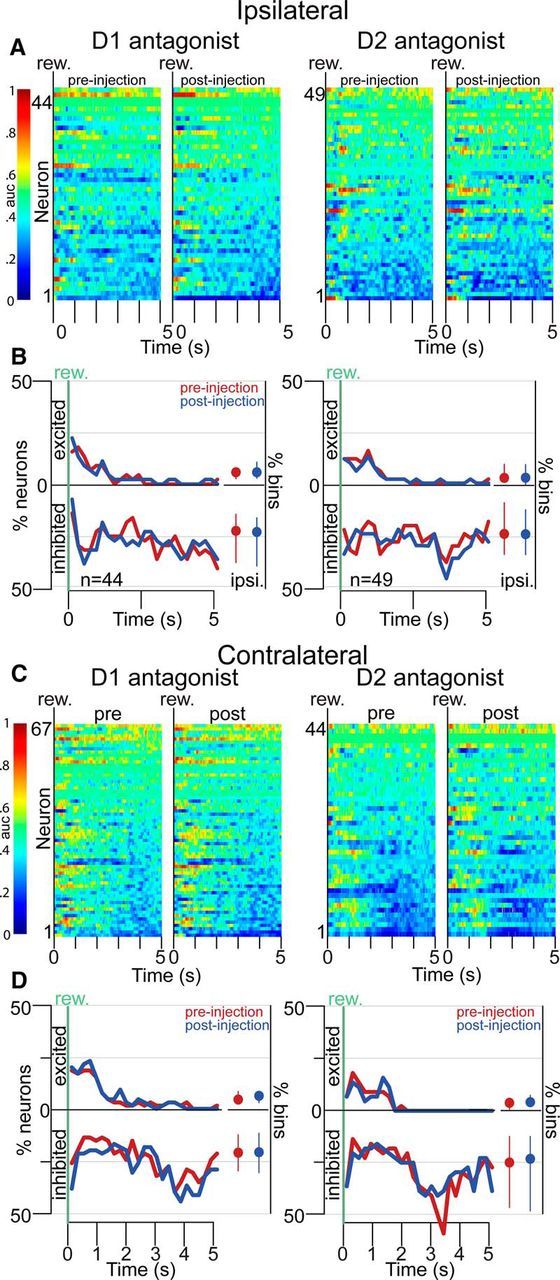
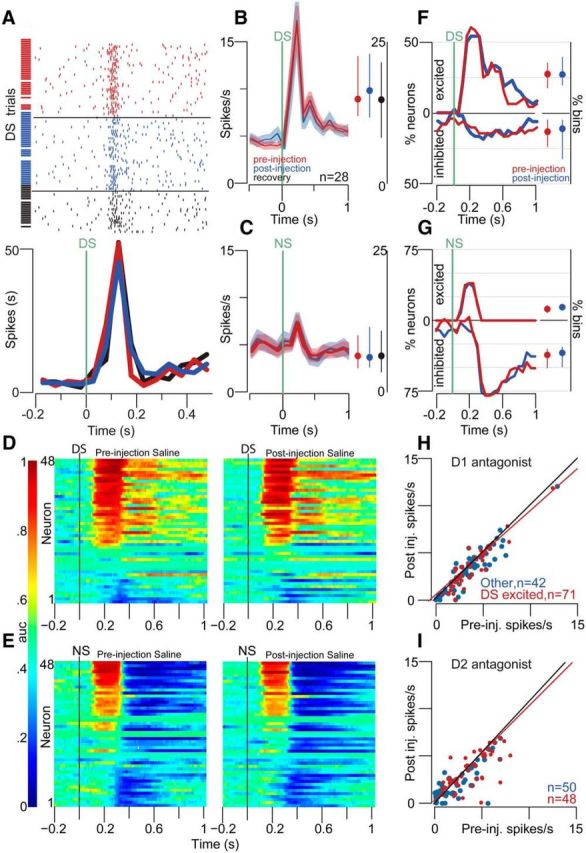
Approach to reward is a fundamental adaptive behavior, disruption of which is a core symptom of addiction and depression. Nucleus accumbens (NAc) dopamine is required for reward-predictive cues to activate vigorous reward seeking, but the underlying neural mechanism is unknown. Reward-predictive cues elicit both dopamine release in the NAc and excitations and inhibitions in NAc neurons. However, a direct link has not been established between dopamine receptor activation, NAc cue-evoked neuronal activity, and reward-seeking behavior. Here, we use a novel microelectrode array that enables simultaneous recording of neuronal firing and local dopamine receptor antagonist injection. We demonstrate that, in the NAc of rats performing a discriminative stimulus task for sucrose reward, blockade of either D1 or D2 receptors selectively attenuates excitation, but not inhibition, evoked by reward-predictive cues. Furthermore, we establish that this dopamine-dependent signal is necessary for reward-seeking behavior. These results demonstrate a neural mechanism by which NAc dopamine invigorates environmentally cued reward-seeking behavior.

Keywords: cue-excited neurons; discriminative stimulus; dopamine; nucleus accumbens; reward seeking.


Figures

Figure 1.
Figure 1.
Effects of dopamine receptor antagonists on DS-cued approach behavior. A, Schematic of the DS task. B, Median (dot) and middle quartiles (vertical lines) of DS (orange) and NS (blue) response ratios in the preinjection period for all behavioral sessions that contributed to neural analyses (p < 0.001, Wilcoxon). C, Cross-session average DS response ratios before, during, and after unilateral (thick, light gray line) and bilateral infusions (thick, dark gray line) of the D1 antagonist (SCH23390, left) and the D2 antagonist (raclopride, right). Overlaid thin lines show individual session response ratios. Blue lines indicate drug infusion. D, Cumulative movement-onset latencies during DS trials in which rats were not moving at cue onset, before (solid lines) and after (dashed lines) D1 antagonist (left graph) and D2 antagonist (right graph) injection. Bilateral injections increased the latencies (solid black and dashed gray lines, corrected p < 0.001, Wilcoxon) whereas unilateral infusions had no effect (solid orange and dashed light orange lines, p > 0.1). N = 51–87 latencies per trace, which came from three (bilateral D2 antagonist) or four (all other injections) sessions. E, F, Left graphs show latency to reach maximum speed after DS onset (max vel., for experimental sessions with video tracking) and latency to reach the lever (lever, for all sessions) before (light gray) and after (dark gray) unilateral D1 antagonist (E) or D2 antagonist (F) injection. Right graphs show maximum (max) and mean speed (avg.) attained during DS movement after DS onset. Individual lines superimposed on all bars are the single session data (pre and post drug infusion) that compose the averages. There was no significant effect of either the D1 or D2 antagonist on any of these movement-related variables [p > 0.1, within-session paired Wilcoxon, n = 4 sessions for all comparisons except bars labeled lever where n = 10 (E) and n = 9 (F)].
Figure 2.
Figure 2.
DS-evoked excitations predict subsequent reward-seeking behavior and encode proximity to the lever. A, Average preinjection peri-event time histograms aligned to the onset of the DS (orange trace) or NS (blue trace) for 145 neurons with significant excitatory responses to DS presentation. Bin width = 50 ms. The light clouds around traces in this and subsequent figures indicate ±SEM. DSs elicit greater excitations than NSs (for firing 100–250 ms after cue onset: p < 0.001, Wilcoxon). B, Peri-event time histogram (orange line) shows the average firing rate, aligned to DS onset, of the 45 neurons that exhibited significant excitatory responses to DS presentation during the subset of experiments for which video tracking data were available. The blue line represents the cumulative distribution of latencies to movement onset after DS presentation for trials in which animals were still at cue onset. DS-evoked excitations typically preceded the initiation of cued approach behavior. C, DS-evoked excitation was greater on trials in which the animal responded to the DS with a lever press (resp.) than when they fail to make such a response (no resp.); **p < 0.01, Wilcoxon. D, DS-evoked excitation was greater on trials in which the latency to reach maximum velocity after DS onset was short than when it was long. Latencies were measured in all DS trials in which the animal made a lever response. Latencies in each session were divided into quartiles, and the firing was compared in trials from the shortest and longest latency quartiles; **p < 0.01, Wilcoxon. E, DS-evoked excitation was greater when rats were near the reward-associated lever compared with when they were far. The distribution of distances from the lever at cue onset was bimodal with a distant peak typically >12.5 cm and a proximate peak <12.5 cm (i.e., rats tended to be either near the lever or across the chamber from the lever). Therefore, “near” and “far” trials were those in which the distance from the lever at cue onset was <12.5 cm and >12.5 cm, respectively; **p < 0.01, Wilcoxon.
Figure 3.
Figure 3.
Example neurons show that D1 and D2 antagonists reduce DS-evoked excitation. Rasters and corresponding histograms show the firing of four different DS-excited neurons aligned to DS onset. Data are from the last 40 trials immediately preceding the start of the injection (red), the first 40 trials immediately after the end of the injection (blue), and the last 20 trials of the behavioral session (black). These intervals roughly correspond to the pre and post injection and recovery periods used in Figures 5 and 6. Horizontal lines to the left of the rasters indicate whether a lever-press response occurred on that trial. Neurons shown in A and B were recorded during bilateral and unilateral SCH23390 infusion, respectively. Neurons in C and D were recorded during bilateral and unilateral raclopride infusions, respectively.
Figure 4.
Figure 4.
The effects of bilateral dopamine antagonist injection on cue-evoked excitation predict the behavioral effects on a trial-by-trial basis. A, C, Trial-by-trial analysis of neuronal encoding of the rat's latency to reach the lever for the same neurons shown in Figure 3A and C. Data from the pre and post injection periods are shown on the left and right, respectively; A shows the effects of SCH23390 and C shows the effects of raclopride (both injected bilaterally). Within the blue-shaded graphs, each row indicates, in grayscale, the neural firing in 50 ms time bins aligned to DS onset on individual trials. Trials are sorted by latency of the rat to reach the lever, which is indicated by the dots in the graph to the right of each firing plot; latencies equal to 10 s indicate that the rat did not respond to the DS. Overall, the antagonists caused larger increases in latency on those trials in which they caused greater reduction of DS-evoked firing. B, D, Cross-neuron distribution of Spearman rank correlation coefficients relating firing (100–400 ms after DS onset) on each trial to the animal's latency to reach the lever. Trials without lever presses were assigned a latency of 10 s (see Experimental Procedures). Only bilateral injection experiments were used for this analysis, and only neurons exhibiting significant DS-evoked excitation in the preinjection period were included. Graphs on the left and right show the coefficients in the preinjection period and after bilateral antagonist injection, respectively. B shows results for SCH23390 injection; D shows results for raclopride injection. Light bars represent neurons with significant correlations (p < 0.05); dark bars represent those with nonsignificant correlations. Arrows show the median coefficient, which was significantly <0 in each case (Wilcoxon, p < 0.05). In D the median correlation coefficient was significantly more negative after D2 antagonist injection than preinjection (Wilcoxon, p < 0.05).
Figure 5.
Figure 5.
D1 receptor activation is required for DS-evoked excitation. A, Peri-event time histograms aligned to DS onset for neurons with significant DS-evoked excitation in the preinjection period. Traces and clouds indicate the average ±SEM firing rate before (red) and after (blue) infusion of SCH23390 bilaterally (left graph), ipsilateral to the recorded neurons (middle graph), or contralateral to them (right graph). Right side of each graph shows the cross-neuron median (dot) and middle quartiles (vertical lines) of firing between 100 and 250 ms after cue onset for neurons with significant excitation; red, blue, and black dots represent pre and post injection and recovery data, respectively. DS-evoked excitations were reduced by bilateral and ipsilateral injections, but not by contralateral injections. **p < 0.01; *p < 0.05, Wilcoxon. B, ROC analysis reveals that only DS-evoked excitations, but not inhibitions, are reduced by SCH23390 injection. For each neuron, a ROC curve was generated for individual 10 ms bins aligned to DS onset. The ROC curve compared the firing rate in the bin with that in the 10 s pre-DS baseline. Every recorded neuron was used; data are divided into that obtained in bilateral injection sessions (left graphs), in the hemisphere ipsilateral to the injection in unilateral injection sessions (middle graphs), and in the hemisphere contralateral to injection (right graphs). Within the graphs, each row shows the AUC for an individual neuron's DS-aligned firing; the AUC values are represented by color and smoothed by averaging across a sliding 50 ms window (see Materials and Methods). The neurons are sorted by the magnitude of DS-evoked excitation 200 ms after cue onset in the preinjection period, and the same neuron is shown in a given row in the preinjection (top row) and postinjection (bottom row) graphs. AUC values of 0.5 indicate that firing is not different from baseline, whereas values closer to 1 indicate excitation (warmer colors) and values closer to 0 indicate inhibition (cooler colors). The ROC plots reveal that the reduction in DS-evoked excitation after bilateral and ipsilateral D1 antagonist injection is consistent across neurons, that there were some emergent inhibitions occurring at long post-DS latency after bilateral (but not ipsilateral or contralateral) injection, and that DS-evoked excitations persist contralateral to the injection. C, Summary of the ROC analysis, identifying the fraction of all recorded neurons showing significant excitation and inhibition in 50 ms bins aligned to DS onset, before and after bilateral (left), ipsilateral (middle), and contralateral (right) infusions. Left side of each graph shows fraction of recorded neurons that was excited in the indicated time bin (lines above 0) and fraction that was inhibited (lines below 0); red and blue lines indicate pre and post injection periods. Right side of each graph shows the cross-neuron median (dot) and middle quartiles (vertical lines) of the fraction of 50 ms bins between 0 and 1 s after cue onset with significant excitation (points above 0) and inhibition (points below 0); red and blue dots represent pre and post injection data, respectively. Neurons with no significant bins before and after injection were excluded from this analysis (see Materials and Methods). **p < 0.01; *p < 0.05, Wilcoxon.
Figure 6.
Figure 6.
D2 receptor activation is necessary for DS-evoked excitation. A, Peri-event time histograms aligned to DS onset for neurons with significant DS-evoked excitation in the period before raclopride injection. DS-evoked excitations were reduced by bilateral and ipsilateral injections, but not by contralateral injections. Format and conventions as in Figure 5A. B, Data are presented in the same format as in Figure 5B, but for all neurons recorded during D2 antagonist injection. The conclusions are also similar: DS-evoked excitations were consistently reduced after bilateral and ipsilateral, but not contralateral, D2 antagonist injections. There were some emergent inhibitions at long post-DS latency after ipsilateral (but not bilateral or contralateral) injection. C, Fraction of neurons showing significant excitation and inhibition in 50 ms bins aligned to DS onset. Format and conventions as in Figure 5C.
Figure 7.
Figure 7.
D1 receptor activation is not required for NS-evoked excitation. A, Peri-event time histograms aligned to NS onset for neurons with significant DS-evoked excitation in the preinjection period. These populations entirely overlap, thus the same neurons were used for the analyses in Figures 5A and 6A. Plotting conventions are identical to those in Figure 5A. **p < 0.01; *p < 0.05, Wilcoxon. B, Graphs show data from the same neurons, recorded in the same sessions, as in Figure 5B; however, the AUC values are aligned to NS onset. The results show that NS-evoked excitations and inhibitions were consistently unaffected by D1 antagonist injection. C, Fraction of neurons showing significant excitation and inhibition in 50 ms bins aligned to NS onset, before and after bilateral (left), ipsilateral (middle), and contralateral (right) infusions. See legend for Figure 5C and Materials and Methods.
Figure 8.
Figure 8.
D2 receptor activation is necessary for NS-evoked excitation. A, Peri-event time histograms aligned to NS onset for neurons with significant DS-evoked excitation in the preinjection period. NS excitation was reduced in the bilateral and ipsilateral conditions but not in contralateral neurons. Format and conventions as in Figure 5A. B, Graphs show data from the same neurons, recorded in the same sessions, as in Figure 7B; however, the AUC values are aligned to NS onset. The results show that NS-evoked excitations were consistently reduced by bilateral and ipsilateral D2 antagonist injection. At long latency after NS onset, some neurons showed emergent inhibition after bilateral and ipsilateral injection. C, Fraction of neurons showing significant excitation and inhibition in 50 ms bins aligned to NS onset. Format and conventions as in Figure 5C.
Figure 9.
Figure 9.
Neural activity aligned to reward receptacle entry is not affected by ipsilateral or contralateral D1 or D2 antagonist injection. A, C, ROC AUC values are calculated and displayed as described in Figure 5B, except time bins are longer (200 ms) and aligned to the animal's entry into the reward receptacle after pressing the lever in response to DS presentation. Animals consumed sucrose reward throughout most of the subsequent 5 s period displayed in the graphs. Neurons are sorted by the average AUC value in the last 3 s of reward (rew.) consumption. Firing in the preinjection (pre) and postinjection (post) periods is shown for unilateral injections of the D1 antagonist SCH23390 (left column) and the D2 antagonist raclopride (right column) that were ipsilateral (A) or contralateral (C) to the recorded neurons. B, D, Fraction of neurons recorded ipsilateral (A) or contralateral (D) to SCH23390 (left) and raclopride (right) injections that exhibit significant excitations or inhibitions after reward receptacle entry. Lines above and below 0 refer to excitatory and inhibitory neural responses, respectively; red and blue lines correspond to preinjection and postinjection periods, respectively. After injection of either antagonist, there was no significant change in the fraction of bins with significant excitation in the 1.5 s after receptacle entry, or the fraction of bins with significant inhibition in the 5 s after receptacle entry (p > 0.1 for both antagonists, Wilcoxon).
Figure 10.
Figure 10.
Saline infusion does not affect DS- or NS-evoked excitation and neither D1 nor D2 receptor activation is required for maintenance of baseline firing rates. A, Single DS-excited neuron recorded during saline infusion. Conventions are identical to those used in Figure 3. B, C, Average DS-aligned (B) and NS-aligned (C) peri-event histogram for neurons exhibiting significant DS-evoked excitation in the preinjection period. The red trace shows data taken from the period before saline injection, and the blue trace shows postsaline injection data. D, E, ROC AUC values were calculated as for Figures 5B and 6B [50 ms bins, aligned to DS (D) or NS (E) onset] for neurons recorded during saline injection. During some unilateral experiments, an antagonist was injected into one hemisphere while saline was injected in the other as a control. Therefore, the neurons shown here are a subset of the neurons recorded contralateral to D1 and D2 antagonist infusions. Neurons were sorted by the AUC value at 200 ms after DS onset, and are presented in the same order in the graphs for the preinjection (left) and postinjection (right) periods. Saline had little or no effect on DS-evoked excitations and inhibitions, ruling out the possibility that local infusion destabilized neural recordings or otherwise reduced DS-evoked neural activity. F, G, Fraction of neurons ipsilateral to saline infusions that exhibited significant excitations or inhibitions after DS (F) and NS (G) onset. Conventions as in Figure 5C. There was no significant change in the fraction of bins with significant excitation or inhibition after saline infusion for either cue (red and blue dot plots show preinjection and postinjection fractions, respectively; p > 0.1, Wilcoxon). H, I, Average baseline firing rate before (x-axis) and after (y-axis) SCH23390 (H) and raclopride (I) injection. Neurons recorded during both bilateral and ipsilateral injections are shown. Red dots indicate neurons that exhibited significant DS-evoked excitation in the preinjection period, and blue dots show baseline firing rates for all other neurons. The black line is the unity line and the red line is a linear fit to baseline firing rates of DS-excited neurons. Slopes of the fitted lines were not significantly different from unity (D1 antagonist, slope = 0.95 ± 0.06, r2 = 0.89; D2 antagonist, slope = 0.86 ± 0.19, r2 = 0.44; errors are SE), indicating that the antagonists did not affect baseline firing rates. Moreover, direct comparison of baseline firing rates before and after injection revealed no significant difference for either antagonist (p > 0.1, Wilcoxon).
Figure 11.
Figure 11.
Histological reconstruction of antagonist injection sites. Figure depicts two coronal sections of rat brain that encompass the majority of the anterior–posterior extent of the NAc (0.8 mm–2.8 mm anterior from bregma). Black dots represent estimates of the location of the cannulae (which were located in the center of the recording arrays).

References

    1. Albin RL, Young AB, Penney JB. The functional anatomy of basal ganglia disorders. Trends Neurosci. 1989;12:366–375. doi: 10.1016/0166-2236(89)90074-X. - DOI - PubMed
    1. Ambroggi F, Ishikawa A, Fields HL, Nicola SM. Basolateral amygdala neurons facilitate reward-seeking behavior by exciting nucleus accumbens neurons. Neuron. 2008;59:648–661. doi: 10.1016/j.neuron.2008.07.004. - DOI - PMC - PubMed
    1. Ambroggi F, Ghazizadeh A, Nicola SM, Fields HL. Roles of nucleus accumbens core and shell in incentive-cue responding and behavioral inhibition. J Neurosci. 2011;31:6820–6830. doi: 10.1523/JNEUROSCI.6491-10.2011. - DOI - PMC - PubMed
    1. Bourne JA. SCH 23390: the first selective dopamine D1-like receptor antagonist. CNS Drug Rev. 2001;7:399–414. doi: 10.1111/j.1527-3458.2001.tb00207.x. - DOI - PMC - PubMed
    1. Brog JS, Salyapongse A, Deutch AY, Zahm DS. The patterns of afferent innervation of the core and shell in the “accumbens” part of the rat ventral striatum: immunohistochemical detection of retrogradely transported fluoro-gold. J Comp Neurol. 1993;338:255–278. doi: 10.1002/cne.903380209. - DOI - PubMed

Publication types

LinkOut - more resources