. 2014 Oct 22;34(43):14484-501.
doi: 10.1523/JNEUROSCI.2567-14.2014.

Inhibiting ACAT1/SOAT1 in microglia stimulates autophagy-mediated lysosomal proteolysis and increases Aβ1-42 clearance

Affiliations

Inhibiting ACAT1/SOAT1 in microglia stimulates autophagy-mediated lysosomal proteolysis and increases Aβ1-42 clearance

Yohei Shibuya et al. J Neurosci. .

Abstract

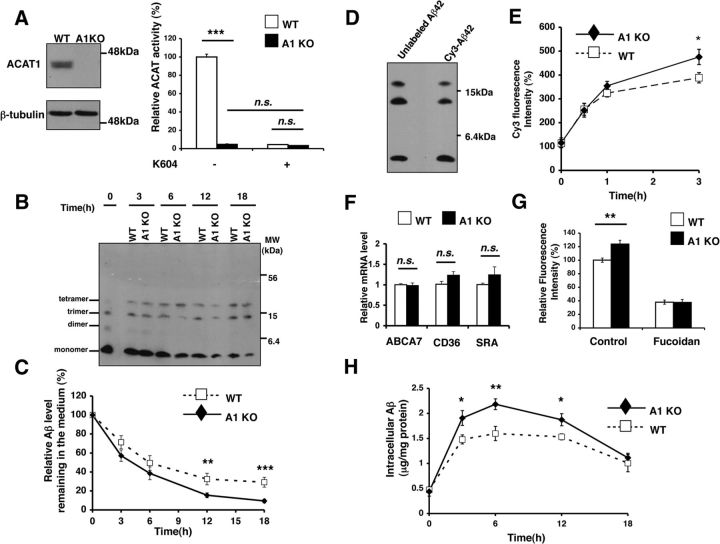
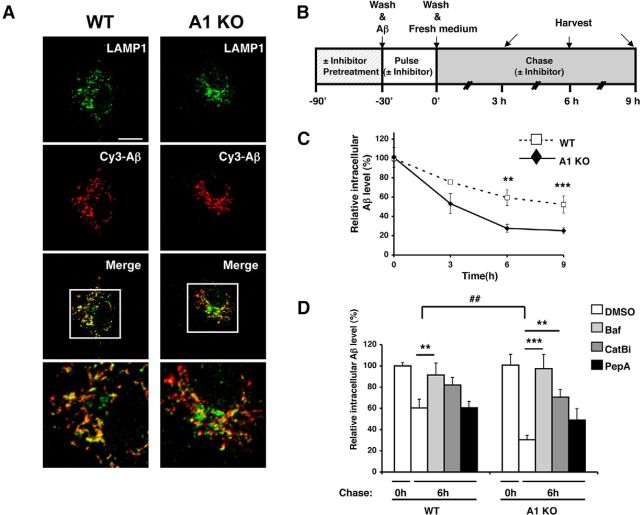
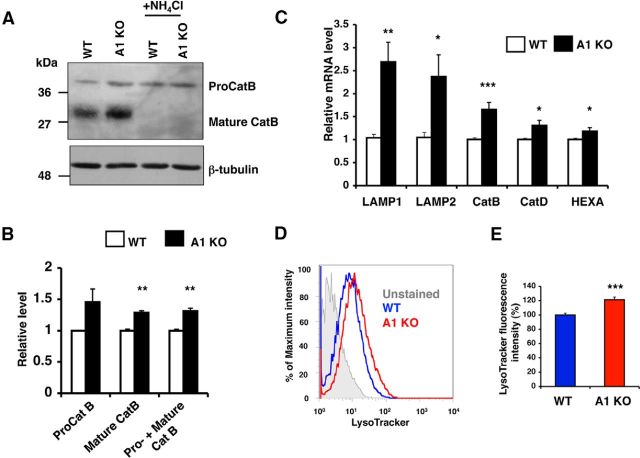
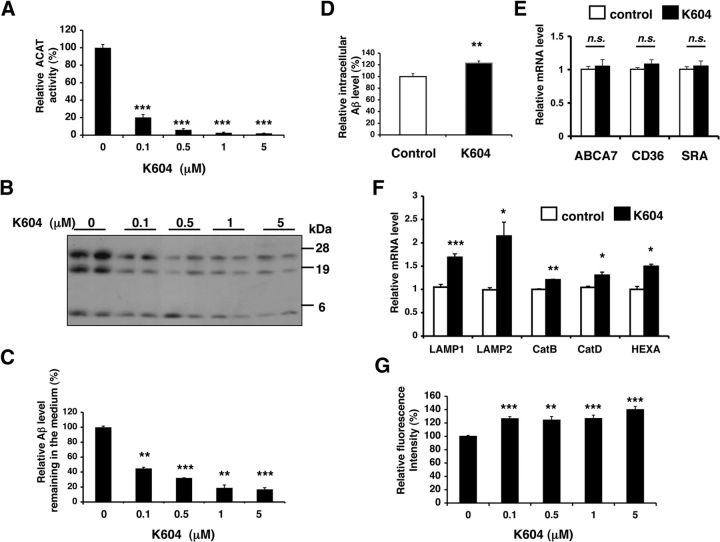
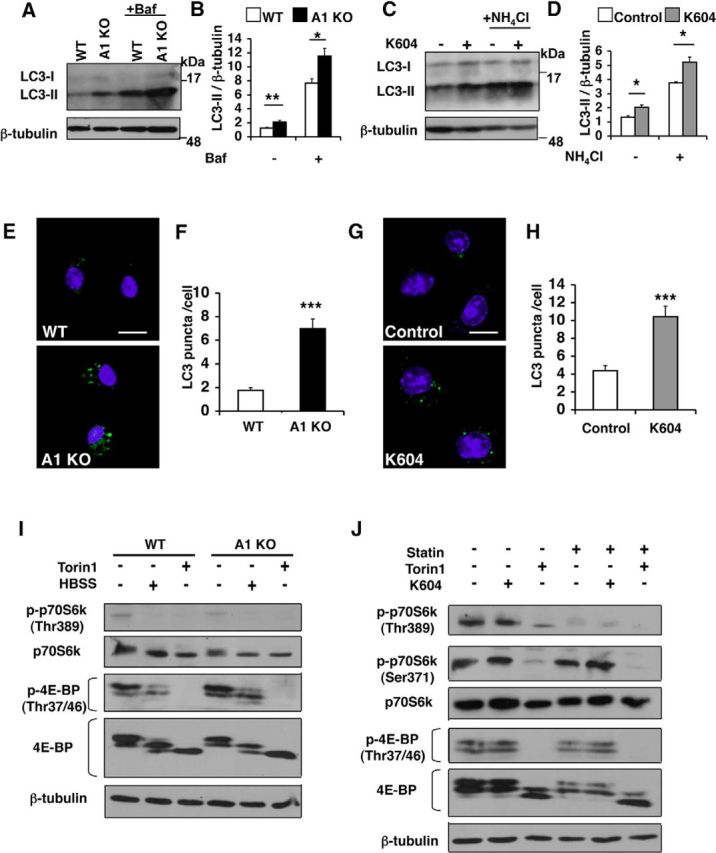
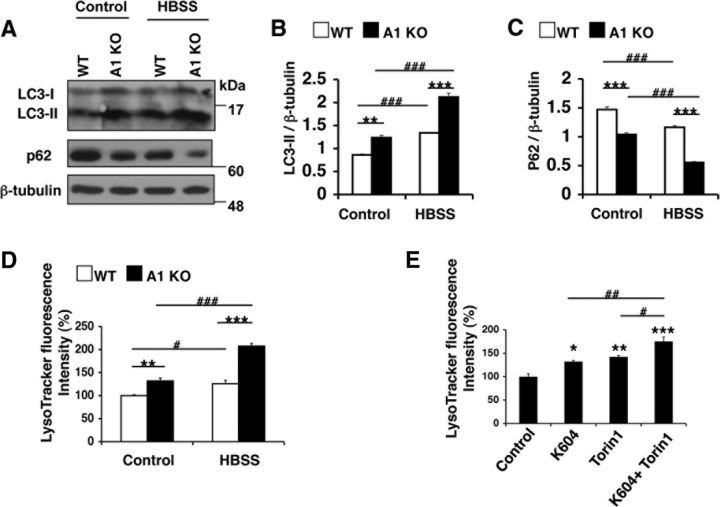
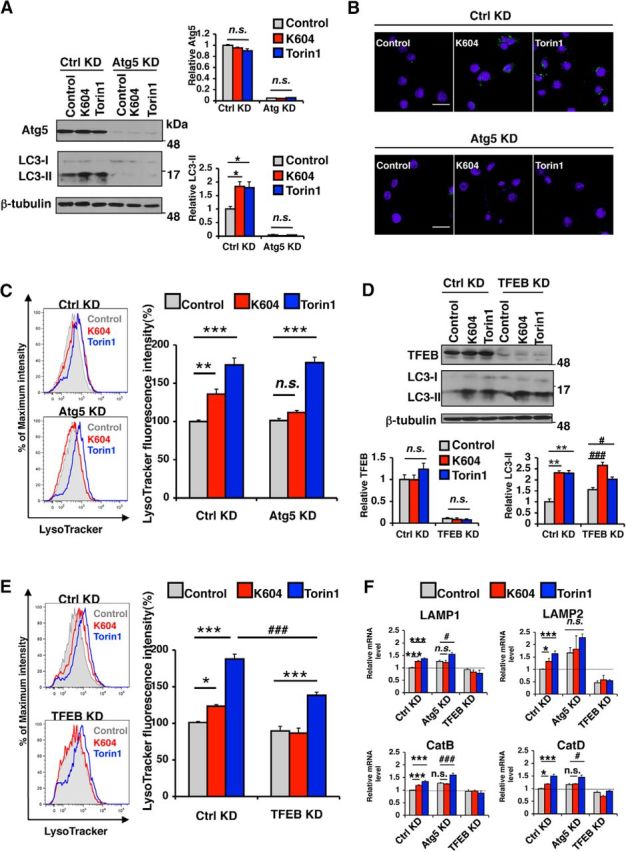
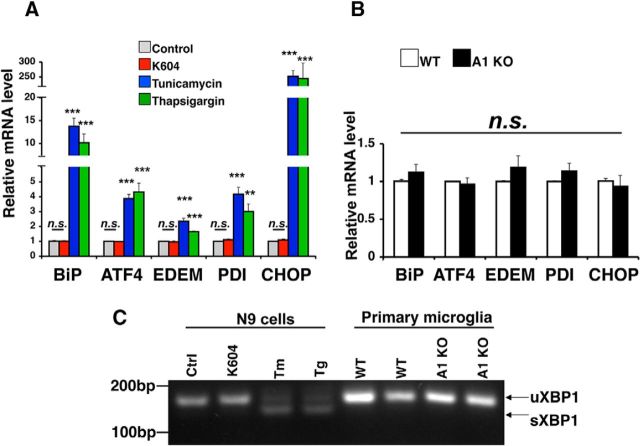
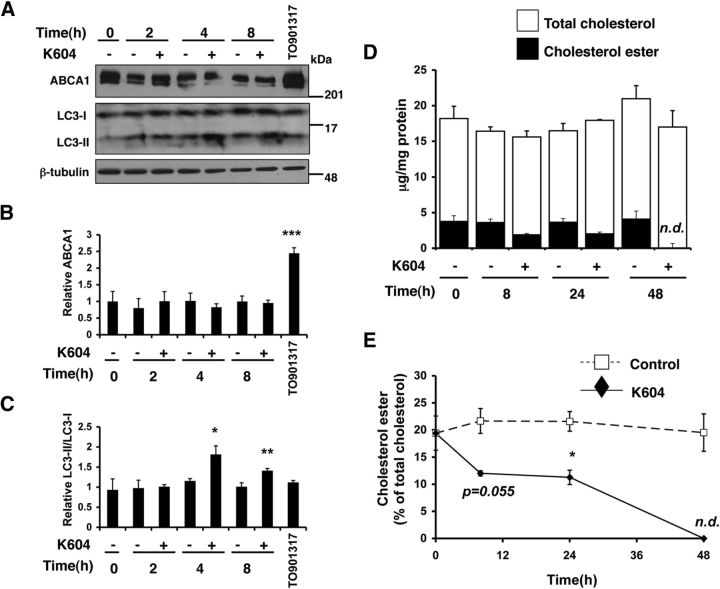
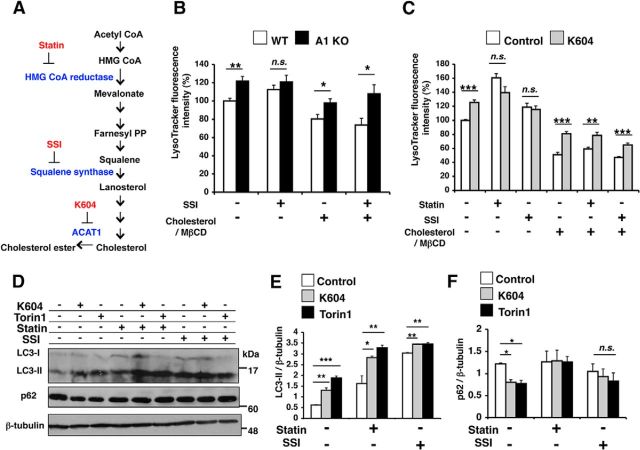
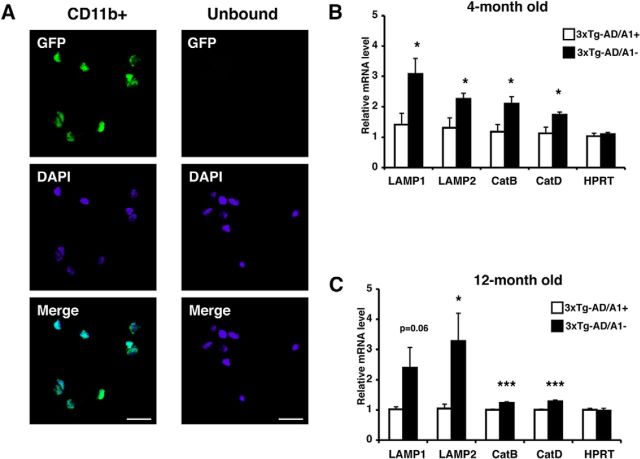
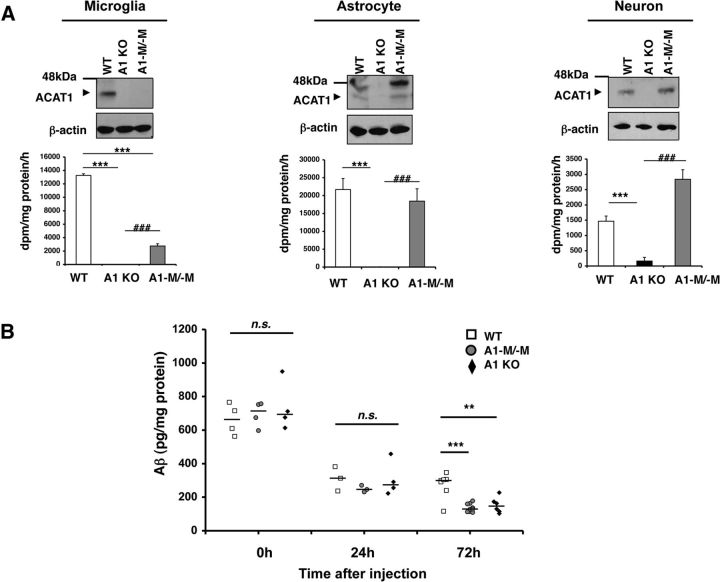
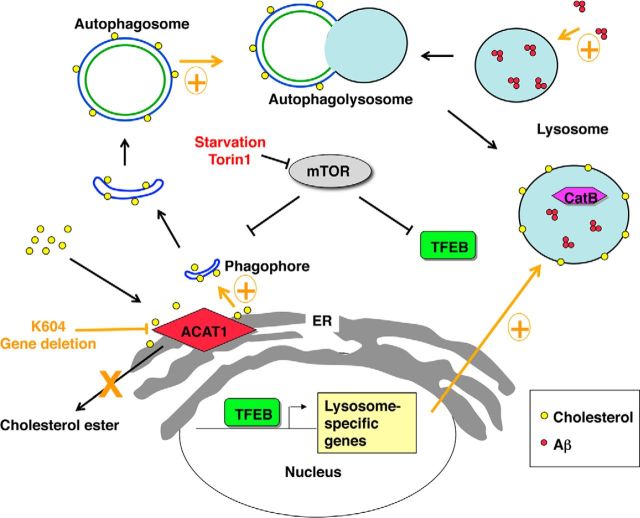
Acyl-CoA:cholesterol acyltransferase 1 (ACAT1) is a resident endoplasmic reticulum enzyme that prevents the buildup of cholesterol in membranes by converting it to cholesterol esters. Blocking ACAT1 pharmacologically or by Acat1 gene knock-out (KO) decreases amyloidopathy in mouse models for Alzheimer's disease. However, the beneficial actions of ACAT1 blockage to treat Alzheimer's disease remained not well understood. Microglia play essential roles in the proteolytic clearance of amyloid β (Aβ) peptides. Here we show that Acat1 gene KO in mouse increases phagocytic uptake of oligomeric Aβ1-42 and stimulates lysosomal Aβ1-42 degradation in cultured microglia and in vivo. Additional results show that Acat1 gene KO or a specific ACAT1 inhibitor K604 stimulates autophagosome formation and transcription factor EB-mediated lysosomal proteolysis. Surprisingly, the effect of ACAT1 blockage does not alter mTOR signaling or endoplasmic reticulum stress response but can be modulated by agents that disrupt cholesterol biosynthesis. To our knowledge, our current study provides the first example that a small molecule (K604) can promote autophagy in an mTOR-independent manner to activate the coordinated lysosomal expression and regulation network. Autophagy is needed to degrade misfolded proteins/peptides. Our results implicate that blocking ACAT1 may provide a new way to benefit multiple neurodegenerative diseases.

Keywords: ACAT; Alzheimer's disease; autophagy; cholesterol; microglia.


Figures

Figure 1.
Figure 1.
A1 KO in microglia caused an increase in Aβ1–42 clearance. A, Microglia were isolated from neonatal wild-type (WT) or Acat1−/− knock-out (A1 KO) mice. ACAT1 protein and activity were analyzed by Western blot and by ACAT activity assay, respectively. In ACAT activity assay, cells were preincubated with or without 1 μm of the ACAT1-specific inhibitor K604 for 24 h. Data are mean ± SEM of two experiments. ***p < 0.001. n.s., Not significant. B, C, G, WT or A1 KO microglia were incubated with 0.5 μm Aβ1–42 for the indicated time. B, The remaining Aβ1–42 in the media was separated by tricine-SDS-PAGE and analyzed by Western blot. Representative blot is shown. C, Oligomeric Aβ1–42 levels (monomer + dimer + trimer + tetramer) in the media were quantified with ImageJ software. Data are mean ± SEM of four experiments. **p < 0.01. ***p < 0.001. D, Aβ1–42 was conjugated to Cy3 dye as described in Materials and Methods. The Cy3-labeled Aβ1–42 (Cy3-Aβ1–42) and unlabeled Aβ1–42 were separated by tricine-SDS-PAGE and analyzed by Western blot. E, WT or A1 microglia were incubated with 0.5 μm Cy3-Aβ1–42 for the indicated time. Cells were washed several times, and intracellular Aβ1–42 levels were analyzed by flow cytometry. Data are mean ± SEM of five experiments. *p < 0.05. F, Expression levels of ABCA7, CD36, and SRA were examined in WT and A1 KO microglia by quantitative PCR (qPCR). Data are mean ± SEM of three experiments. n.s., Not significant. G, WT or A1 microglia were pretreated with 400 μg/ml of fucoidan for 1 h and then incubated with 0.5 μm of Cy3-Aβ1–42 for 3 h in the presence of the same inhibitor. Cells were washed several times, and intracellular Cy3-Aβ1–42 levels were analyzed by flow cytometry. Data are mean ± SEM of four experiments. **p < 0.01. H, Intracellular Aβ1–42 levels in WT and A1 KO microglia at the indicated time point were analyzed by ELISA. Data are mean ± SEM of three experiments. *p < 0.05. **p < 0.01.
Figure 2.
Figure 2.
A1 KO in microglia caused an increase in intracellular Aβ1–42 degradation in lysosomes. A, WT or A1 KO microglia were incubated with 0.5 μm Cy3-Aβ1–42 (red) for 3 h and immunostained with anti-LAMP1 antibody (green) for late endosomes/lysosomes. Cells were imaged using a confocal microscope. Representative immunofluorescence images are shown. Bottom, Enlarged images of the boxed areas in the top. Scale bar, 10 μm. B, Diagram demonstrating the procedure used to conduct pulse-chase experiments with or without various inhibitors. C, D, Pulse-chase experiments were performed in WT or A1 KO microglia, in a manner described in B and in Materials and Methods. Briefly, WT or A1 KO microglia were incubated with 0.5 μm Aβ1–42 for 30 min. Cells were preincubated with (D) or without (C) inhibitors as indicated for 90 min before exposure to oligomeric Aβ (Baf, bafilomycin A1; CatBi, cathepsin B inhibitor; PepA, pepstatin A methyl ester). Cells were washed several times and incubated in serum-free medium for the indicated time. At the end of incubation, cells were washed and lysed. Intracellular Aβ1–42 levels were examined by ELISA and normalized with cellular protein concentration. Data are mean ± SEM of three experiments. **p < 0.01. ***p < 0.001. ##p < 0.01.
Figure 3.
Figure 3.
A1 KO in microglia caused increases in lysosome-specific gene expressions and in lysosome volume. A, B, Cathepsin B (CatB) protein levels in WT or A1 KO microglia were analyzed by Western blot. To identify proCatB and mature CatB, cells were treated with 25 mm NH4Cl for 3 h. A, Representative blot. B, Expression levels of proCatB (40 kDa) and mature CatB (30 kDa) were quantified using ImageJ software. Values are mean ± SEM of three experiments. **p < 0.01. C, Expression levels of lysosome-specific genes were examined by qPCR in WT or A1 KO microglia. Data are mean ± SEM of five experiments. *p < 0.05. **p < 0.01. ***p < 0.001. D, E, Cellular acidic compartments were analyzed by LysoTracker staining (50 nm, 30 min) followed by flow cytometry. D, Representative histogram. E, Data are mean ± SEM of four experiments. ***p < 0.001.
Figure 4.
Figure 4.
Inhibiting ACAT1 in N9 microglial cell line caused increases in Aβ1–42 clearance and in lysosome volume. A, N9 cells were treated with K604 at the indicated concentrations for 24 h. ACAT activity assay was performed in intact cells. Data are mean ± SEM of three independent experiments. ***p < 0.001. B, C, N9 cells were pretreated with K604 at the indicated concentrations for 24 h and then incubated with 0.5 μm Aβ1–42 for 12 h in the presence of K604. At the end of incubation, media were collected and the residual Aβ1–42 levels in media were detected by Western blot. B, Representative blot. C, Quantification data are mean ± SEM of two experiments. ***p < 0.001. D, N9 cells were preincubated with or without 0.5 μm K604 for 8 h and then incubated with 0.5 μm Cy3-Aβ1–42 for 3 h in the presence or absence of 0.5 μm K604. Cells were washed several times, and intracellular Aβ1–42 levels were analyzed by flow cytometry. Data are mean ± SEM of three experiments. **p < 0.01. E, N9 cells were treated with 0.5 μm K604 for 8 h. Expression levels of ABCA7, CD36, and SRA were examined by qPCR. Data are mean ± SEM of three experiments. n.s., Not significant. F, N9 cells were treated with 0.5 μm K604 for 8 h. Expression levels of lysosome-specific genes were examined by qPCR. Data are mean ± SEM of three experiments. *p < 0.05. **p < 0.01. ***p < 0.001. G, N9 cells were incubated with K604 at the indicated concentrations for 8 h. Cellular acidic compartments were analyzed by LysoTracker staining (50 nm, 30 min) followed by flow cytometry. Data are mean ± SEM of three experiments. **p < 0.01. ***p < 0.001.
Figure 5.
Figure 5.
Blocking ACAT1 caused an increase in autophagy flux in an mTOR-independent manner. A, B, Microglia were treated with or without 0.25 μm Baf for 3 h. Cell lysates were analyzed by Western blot for LC3. A, Representative blot. B, Values are mean ± SEM of three experiments. *p < 0.05. **p < 0.01. C, D, N9 cells were treated with 0.5 μm K604 for 8 h, with or without 25 mm NH4Cl for the last 3 h of incubation. Cell lysates were analyzed by Western blot for LC3. C, Representative blot. D, Values are mean ± SEM of three experiments. *p < 0.01. E, F, Microglia were immunostained: LC3 (green) and DAPI (blue). E, Representative pictures. Scale bar, 10 μm. F, Numbers of LC3 puncta per cell were counted in at least 50 cells/genotype using ImageJ software. Values are mean ± SEM. ***p < 0.001. G, H, N9 cells were incubated with or without 0.5 μm K604 for 8 h and immunostained: LC3 (green) and DAPI (blue). G, Representative pictures. Scale bar, 10 μm. H, Numbers of LC3 puncta per cell were counted in at least 70 cells/condition using ImageJ software. Values are mean ± SEM. ***p < 0.001. I, WT or A1 KO microglia were incubated with 0.25 μm Torin1 or with Hanks Balanced Salt Solution (HBSS) only for 3 h. Cell lysates were analyzed by Western blot for phospho and total levels of, p70S6K and 4E-BP. The blot shown is representative of two experiments. J, N9 cells were grown in the absence or presence of 50 μm lovastatin (statin) and 230 μm mevalonate for 48 h. Cells were then incubated with 0.5 μm K604 for 8 h or with 0.25 μm Torin1 for 3 h in the absence or presence of statin/mevalonate. mTOR activity was analyzed by Western blot for phospho and total levels of p70S6K and 4E-BP. The blot shown is representative of two experiments.
Figure 6.
Figure 6.
ACAT1 blockage and mTOR inhibition produced additive effects on autophagy flux and lysosome volume. A–D, Microglia were incubated in HBSS only for 3 h. A, Cell lysates were analyzed by Western blot for LC3 and for p62. Representative Western blot. B, C, Data are mean ± SEM of three experiments. **p < 0.01. ***p < 0.001. D, Cellular acidic compartments were analyzed by LysoTracker staining (50 nm, 30 min) followed by flow cytometry. Values are mean ± SEM of three experiments. **p < 0.01. ***p < 0.001. #p < 0.05. ###p < 0.001. E, N9 cells were treated with various inhibitors as indicated (0.5 μm K604 for 8 h, or 0.25 μm Torin1 for 3 h, or 0.5 μm K604 for 8 h and 0.25 μm Torin1 for the last 3 h of incubation). Cellular acidic compartments were analyzed by LysoTracker staining (50 nm, 30 min) followed by flow cytometry. Values are mean ± SEM of three experiments. *p < 0.05. **p < 0.01. ***p < 0.001. #p < 0.05. ##p < 0.01.
Figure 7.
Figure 7.
The effect of ACAT1 inhibition on lysosome biogenesis depended on autophagosome formation and on TFEB. A–E, F, N9 cells were transfected with control siRNA (Ctrl KD), or Atg5 siRNA (Atg5 KD) or TFEB siRNA (TFEB KD) for 72 h in RPMI containing 10% FBS and then incubated in fresh medium with 0.5 μm K604 for 8 h or with 0.25 μm Torin1 for 3 h. A, Cell lysates were analyzed by Western blot for Atg5 and for LC3. Representative blot. Quantification data are mean ± SEM of two experiments. *p < 0.05. n.s., Not significant. B, N9 cells were immunostained with anti-LC3 antibody (green) and DAPI (blue) and visualized under confocal microscopy. Scales bar, 20 μm. C, E, Cellular acidic compartments were analyzed by LysoTracker staining (50 nm, 30 min) followed by flow cytometry. Representative histograms. Relative fluorescence intensity data were results of three experiments. Values are mean ± SEM of three experiments. *p < 0.05. **p < 0.01. ***p < 0.001. ###p < 0.001. n.s., Not significant. D, Cell lysates were analyzed by Western blot for TFEB and LC3. Representative blot. Quantification data are mean ± SEM of two experiments. **p < 0.01. #p < 0.05. ###p < 0.001. n.s., Not significant. F, Expression levels of lysosome-specific genes were analyzed by qPCR. Data are mean ± SEM of four experiments. *p < 0.05. ***p < 0.001. #p < 0.05. ###p < 0.001. n.s., Not significant.
Figure 8.
Figure 8.
Blocking ACAT1 did not induce ER stress in microglia. A, N9 cells were treated with 0.5 μm K604, or with 2.5 μg/ml tunicamycin, or with 1 μm thapsigargin for 8 h. Total RNA was isolated, and cDNA was synthesized using reverse transcriptase. Expression levels of UPR-target genes were analyzed by qPCR. Data are mean ± SEM of two experiments. **p < 0.01. ***p < 0.001. n.s., Not significant. B, Expression levels of UPR-target genes were determined by qPCR. cDNA was synthesized from total RNA obtained from primary microglia. Data are mean ± SEM of three experiments. n.s., Not significant. C, Unspliced form (uXBP1) and spliced form (sXBP1) of XBP1 were detected by RT-PCR. Tm, tunicamycin; Tg, thapsigargin.
Figure 9.
Figure 9.
Inhibiting ACAT1 in N9 cell within 8 h did not increase ABCA1 protein level. A–C, N9 cells were treated with 0.5 μm K604 for the indicated time or with 10 μm TO901317 for 24 h. Cell lysates were analyzed by Western blot for ABCA1 and LC3. A, Representative blot. B, C, Data are mean ± SEM of two experiments. *p < 0.5. **p < 0.01. ***p < 0.001. D, E, N9 cells were treated with 1 μm K604 for the indicated time. Cellular lipids were extracted, and cellular cholesterol and cholesterol ester levels were determined as described in Materials and Methods. Experiment was performed in triplicate, and data are mean ± SEM. *p < 0.5. n.d., not detectable.
Figure 10.
Figure 10.
The effect of ACAT1 blockage on lysosome volume was sensitive to endogenous cholesterol biosynthesis. A, Cholesterol biosynthesis pathway and inhibitors used in this study and their target enzymes. B, WT or A1 KO microglia were incubated with 1 μm squalene synthase inhibitor (SSI) and/or 31.25 μm cholesterol in complex with 250 μm methyl-β-cyclodextrin (cholesterol/MbCD) for 24 h. LysoTracker-positive compartments were analyzed by LysoTracker staining (50 nm, 30 min) flow cytometry. Data are mean ± SEM of two experiments. *p < 0.05. **p < 0.01. n.s., Not significant. C, N9 cells were pretreated with the following agents: 50 μm lovastatin/230 μm mevalonate (statin) for 48 h, or 1 μm SSI for 24 h, or 31.25 μm cholesterol/MβCD for 48 h. Cells were then incubated with 0.5 μm K604 for 8 h in the presence of the same agents; 50 nm LysoTracker was added for the last 30 min of incubation. Fluorescence intensity was examined by flow cytometry. Data are mean ± SEM of three experiments. **p < 0.01. ***p < 0.001. n.s., Not significant. D–F, N9 cells were pretreated with 50 μm statin for 48 h or 1 μm SSI for 24 h. Cells were then incubated with 0.5 μm K604 for 8 h or 0.25 μm Torin1 for 3 h. Cell lysates were analyzed by Western blot for LC3 and p62. D, Representative blot. E, F, Data are mean ± SEM of three experiments. *p < 0.5. **p < 0.01. ***p < 0.001. n.s., Not significant.
Figure 11.
Figure 11.
A1 KO caused an increase in lysosome biogenesis in microglia in vivo. A, Microglia were isolated from adult CX3CR1/GFP+/+ mice as described in Materials and Methods. The GFP-positive cell population was viewed under fluorescence microscopy. Representative pictures are shown. Scale bar, 20 μm. B, C, Cd11b+ microglia were isolated from adult 3XTg-AD/A1+ and 3XTg-AD/A1 mice at (B) 4 months of age (n = 7 mice per genotype) and (C) 12 months of age (n = 8 mice per genotype). Total RNAs were isolated from microglia, and expression levels of lysosome-specific genes were analyzed by qPCR. Values are mean ± SEM. *p < 0.05. ***p < 0.001.
Figure 12.
Figure 12.
A1 KO stimulated Aβ clearance in vivo. A, Primary microglia, astrocytes, and neurons were isolated from neonatal WT, A1 KO, and A1-M/-M mice. Cell lysates were analyzed by Western blot for ACAT1. ACAT enzyme activity was measured in primary cell cultures. Data are mean ± SEM of two experiments. **p < 0.01. ***p < 0.001. ###p < 0.001. B, WT (n = 14), A1-M/-M (n = 16), and A1 KO (n = 13) female mice at 7–8 weeks of age were anesthetized, and 1 μl/mouse of oligomeric Aβ1–42 (0.22 μg/μl) was stereotaxically injected into the dentate gyrus of the hippocampus. Mice were killed at the indicated time point, and the hippocampi were isolated. Aβ1–42 levels in detergent-soluble fractions (see Materials and Methods for details) were determined by ELISA. Horizontal bars represent median values. **p < 0.01. ***p < 0.001. n.s., Not significant.
Figure 13.
Figure 13.
A working model for the ACAT1 blockage-dependent increase in autophagy and lysosome biogenesis. ACAT1 blockage causes increases in autophagy flux and TFEB-mediated lysosome biogenesis in an mTOR/ER stress-independent manner. The effect of ACAT1 inhibition on lysosome biogenesis is sensitive to endogenous cholesterol biosynthesis. Increased autophagic flux may also result in higher levels of Aβ1–42 uptake in ACAT1-inhibited microglia.

References

    1. Abe-Dohmae S, Ikeda Y, Matsuo M, Hayashi M, Okuhira K, Ueda K, Yokoyama S. Human ABCA7 supports apolipoprotein-mediated release of cellular cholesterol and phospholipid to generate high density lipoprotein. J Biol Chem. 2004;279:604–611. doi: 10.1074/jbc.M309888200. - DOI - PubMed
    1. Area-Gomez E, Del Carmen Lara Castillo M, Tambini MD, Guardia-Laguarta C, de Groof AJ, Madra M, Ikenouchi J, Umeda M, Bird TD, Sturley SL, Schon EA. Upregulated function of mitochondria-associated ER membranes in Alzheimer disease. EMBO J. 2012;31:4106–4123. doi: 10.1038/emboj.2012.202. - DOI - PMC - PubMed
    1. Balducci C, Beeg M, Stravalaci M, Bastone A, Sclip A, Biasini E, Tapella L, Colombo L, Manzoni C, Borsello T, Chiesa R, Gobbi M, Salmona M, Forloni G. Synthetic amyloid-β oligomers impair long-term memory independently of cellular prion protein. Proc Natl Acad Sci U S A. 2010;107:2295–2300. doi: 10.1073/pnas.0911829107. - DOI - PMC - PubMed
    1. Bhattacharyya R, Barren C, Kovacs DM. Palmitoylation of amyloid precursor protein regulates amyloidogenic processing in lipid rafts. J Neurosci. 2013;33:11169–11183. doi: 10.1523/JNEUROSCI.4704-12.2013. - DOI - PMC - PubMed
    1. Boland B, Kumar A, Lee S, Platt FM, Wegiel J, Yu WH, Nixon RA. Autophagy induction and autophagosome clearance in neurons: relationship to autophagic pathology in Alzheimer's disease. J Neurosci. 2008;28:6926–6937. doi: 10.1523/JNEUROSCI.0800-08.2008. - DOI - PMC - PubMed

Publication types