. 2015 Jan;89(1):535-44.
doi: 10.1128/JVI.02751-14. Epub 2014 Oct 22.

The sheep tetherin paralog oBST2B blocks envelope glycoprotein incorporation into nascent retroviral virions

Affiliations

The sheep tetherin paralog oBST2B blocks envelope glycoprotein incorporation into nascent retroviral virions

Lita Murphy et al. J Virol. 2015 Jan.

Abstract

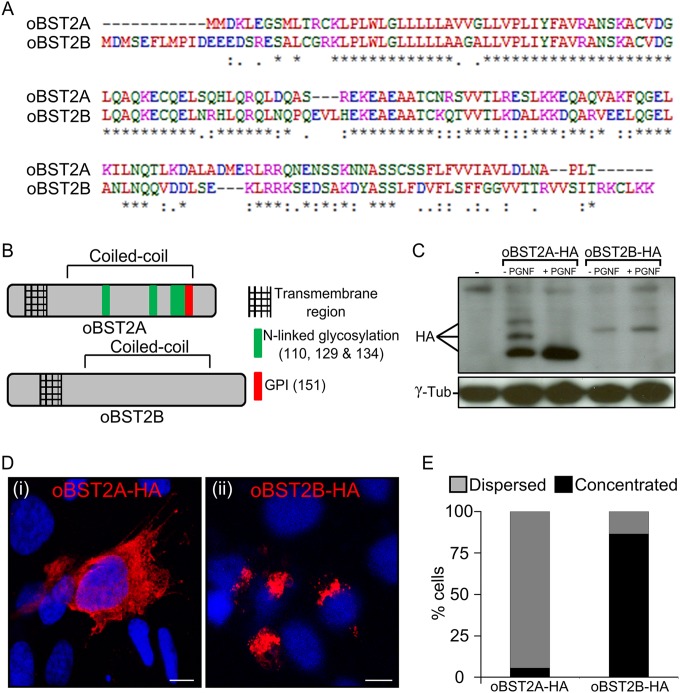
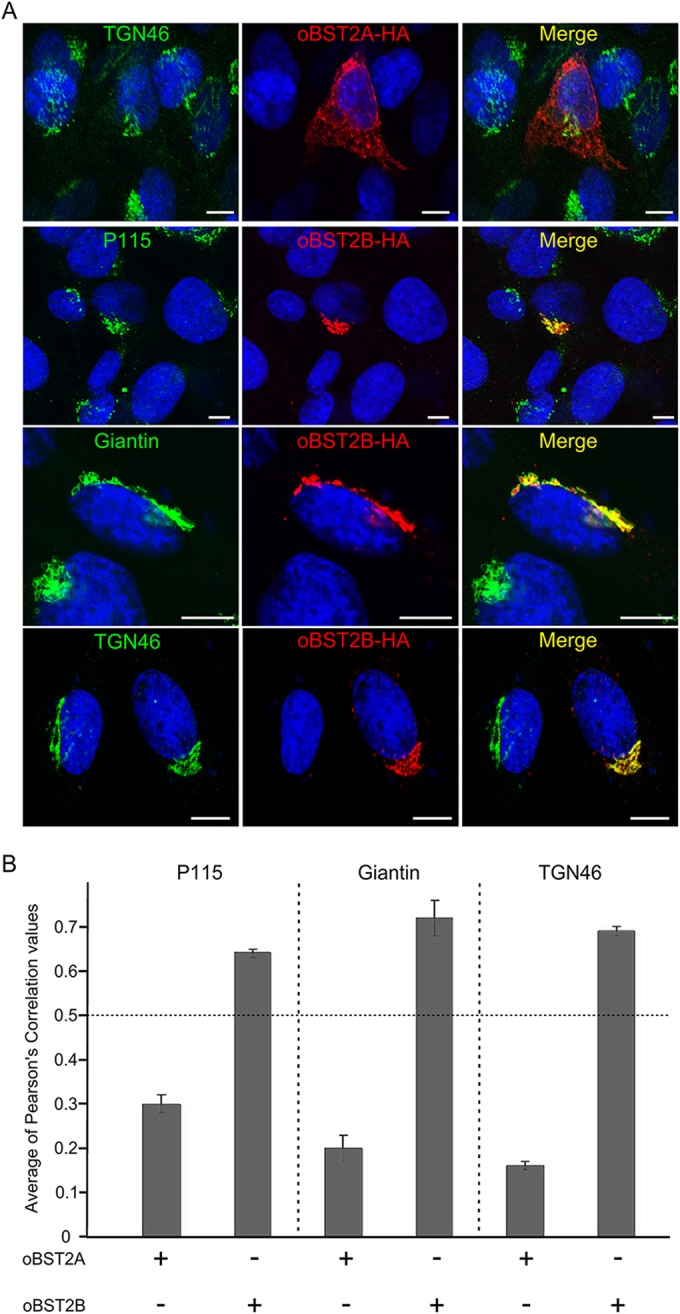
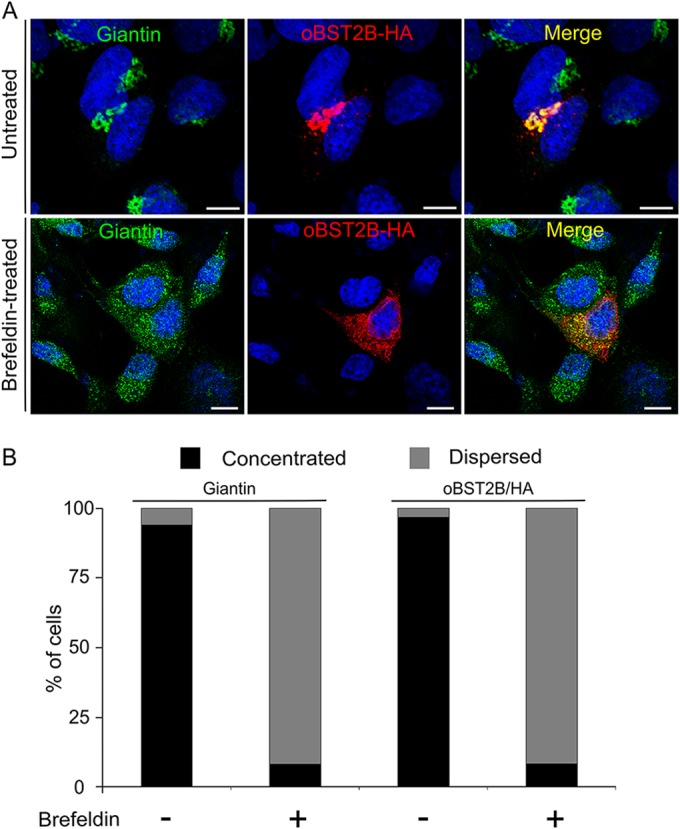
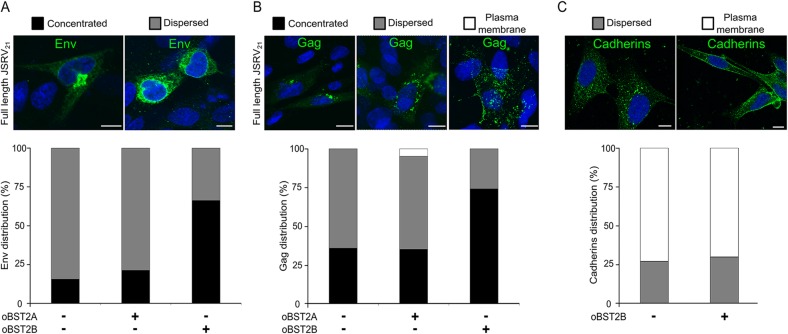
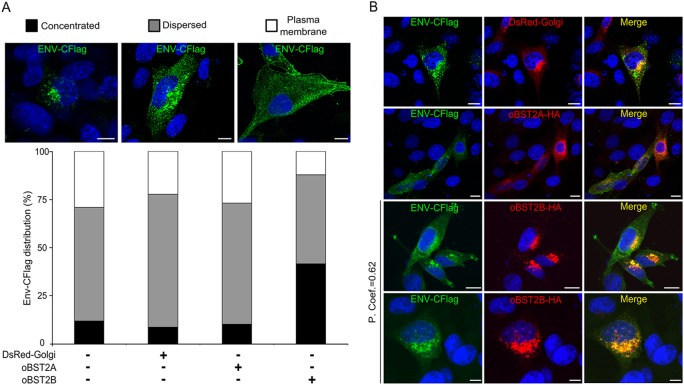
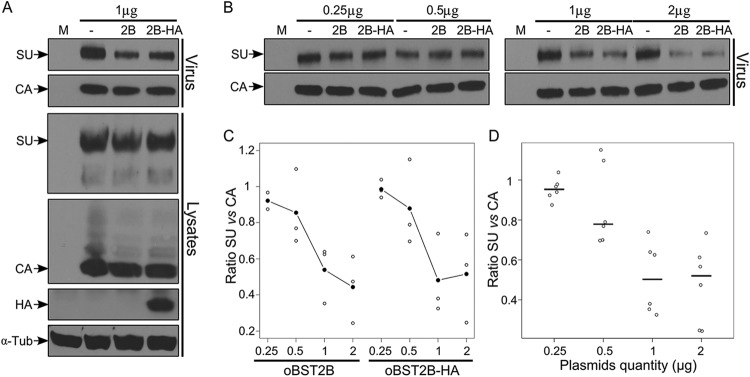
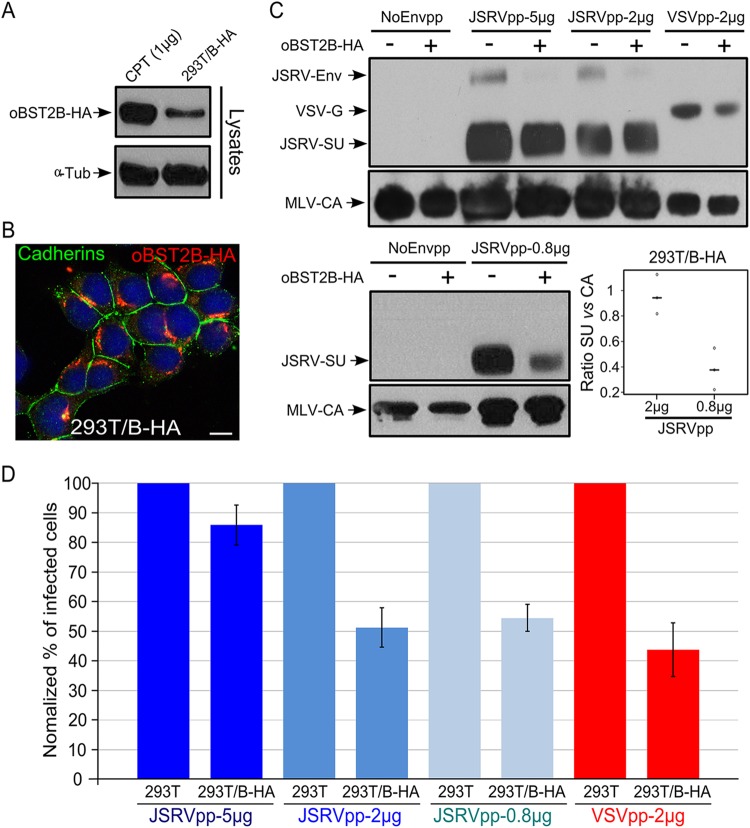
Bone marrow stromal cell antigen 2 (BST2) is a cellular restriction factor with a broad antiviral activity. In sheep, the BST2 gene is duplicated into two paralogs termed oBST2A and oBST2B. oBST2A impedes viral exit of the Jaagsiekte sheep retroviruses (JSRV), most probably by retaining virions at the cell membrane, similar to the "tethering" mechanism exerted by human BST2. In this study, we provide evidence that unlike oBST2A, oBST2B is limited to the Golgi apparatus and disrupts JSRV envelope (Env) trafficking by sequestering it. In turn, oBST2B leads to a reduction in Env incorporation into viral particles, which ultimately results in the release of virions that are less infectious. Furthermore, the activity of oBST2B does not seem to be restricted to retroviruses, as it also acts on vesicular stomatitis virus glycoproteins. Therefore, we suggest that oBST2B exerts antiviral activity using a mechanism distinct from the classical tethering restriction observed for oBST2A.

Importance: BST2 is a powerful cellular restriction factor against a wide range of enveloped viruses. Sheep possess two paralogs of the BST2 gene called oBST2A and oBST2B. JSRV, the causative agent of a transmissible lung cancer of sheep, is known to be restricted by oBST2A. In this study, we show that unlike oBST2A, oBST2B impairs the normal cellular trafficking of JSRV envelope glycoproteins by sequestering them within the Golgi apparatus. We also show that oBST2B decreases the incorporation of envelope glycoprotein into JSRV viral particles, which in turn reduces virion infectivity. In conclusion, oBST2B exerts a novel antiviral activity that is distinct from those of BST2 proteins of other species.


Figures

FIG 1
FIG 1
oBST2A and -2B have different biological features. (A) Alignment of the amino acid sequences of the ovine BST2 proteins (oBST2A and -2B). An asterisk (*) indicates an identical amino acid, a period (.) indicates weak similarity, and a colon (:) indicates strong similarity. (B) Schematic diagram illustrating the main structural features and predicted posttranslational modifications of oBST2A and -2B. (C) HEK-293T cells were transiently transfected with expression plasmids for oBST2A-HA or -2B-HA. Cell lysates were harvested and incubated in the presence and absence of PNGase F overnight. Proteins were then separated by SDS-PAGE and visualized by Western blotting using an HA antibody. γ-Tubulin was used as a sample-loading control. (D) Confocal microscopy images of oBST2A-HA and oBST2B-HA in transiently transfected CPT-Tert cells display two different patterns: (i) dispersed within the cytoplasm and cell membrane and (ii) concentrated in a perinuclear region. Scale bars in both panels represent 10 μm. (E) Graph representing the number (%) of cells in which oBST2A-HA- and oBST2B-HA-staining patterns were counted as dispersed or concentrated. At least 75 cells in random fields from two independent experiments were scored.
FIG 2
FIG 2
oBST2B localizes to the Golgi apparatus. (A) CPT-Tert cells were transfected with oBST2A-HA or oBST2B-HA and analyzed 18 h after transfection by confocal microscopy using, respectively, antibodies against the HA epitope (to detect oBST2A-HA or oBST2B-HA protein) and the Golgi markers: p115, giantin, TGN46, and appropriate secondary conjugated antibodies. Scale bars in all panels represent 10 μm. (B) Colocalization of oBST2A-HA and oBST2B-HA with Golgi markers was measured in at least 50 cells from two independent experiments with Image-Pro Plus software using Pearson's correlation coefficient. Any values above 0.5 were regarded as representing significant colocalization.
FIG 3
FIG 3
oBST2B localization is altered by treatment with brefeldin A. (A) CPT-Tert cells were transfected with oBST2B-HA expression plasmids. Eighteen hours after transfection, cells were treated or not treated with 200 ng/ml of brefeldin A for 90 min, fixed, and analyzed by confocal microscopy using antibodies to the giantin Golgi marker and the HA epitope as indicated. Two different staining patterns were observed: (i) dispersed within the cytoplasm and (ii) concentrated in a perinuclear region. Scale bars in all panels represent 10 μm. (B) Graph representing the number (%) of cells in which oBST2B-HA and giantin staining were observed to be concentrated as opposed to dispersed. At least 100 cells from two independent experiments were evaluated randomly.
FIG 4
FIG 4
oBST2A and oBST2B both redistribute intracellular Env and Gag. CPT-Tert cells were transfected with the full-length JSRV21 expression plasmid with either an empty plasmid or expression plasmids for oBST2A-HA or oBST2B-HA. CPT-Tert cells were also transfected with an expression plasmid for oBST2B-HA in order to assess the influence of this protein on the intracellular distribution of cellular cadherins. Upon immunostaining with the appropriate antibody, the intracellular distributions of Env (A), Gag (B), and cadherins (C) were scored and counted as concentrated or dispersed or at the plasma membrane using confocal microscopy. Scale bars in all panels represent 10 μm. Graphs represent the number (%) of cells in which the intracellular distribution of Env (A), Gag (B), or cadherins (C) displays a concentrated, dispersed, or plasma membrane staining pattern. At least 100 cells in random fields from two independent experiments were counted.
FIG 5
FIG 5
oBST2B colocalizes with JSRV Env. (A) CPT-Tert cells transfected with the JSRV Env-CFlag-expressing plasmid with either an empty pcDNA3.1 vector, pDsRed-Golgi, pCIoBST2A-HA, or -2B-HA were analyzed by confocal microscopy. The intracellular distribution of Env-CFlag was scored as concentrated, dispersed, or at the plasma membrane using confocal microscopy. Scale bars in all panels represent 10 μm. The graph represents the number (%) of cells in which the intracellular distribution of Env-CFlag displays a concentrated, dispersed, or plasma membrane staining pattern. At least 100 cells in random fields from two independent experiments were counted. (B) Representative pictures of CPT-Tert cells coexpressing Env-CFlag with DsRed-Golgi, oBST2A-HA, or oBST2B-HA. Colocalization of Env-CFlag with oBST2B-HA in a perinuclear region was measured in at least 50 cells from two independent experiments with Image-Pro Plus software using Pearson's correlation coefficient (P. Coef.). Any value above 0.5 was regarded as significant. Scale bars in all panels represent 10 μm.
FIG 6
FIG 6
oBST2B reduces the incorporation of JSRV Env into virions. (A) Representative Western blots of concentrated viral particles from supernatants (virus) and cellular extracts (lysates) of mock-CPT-Tert-transfected cells (M) or cells transfected with expression plasmids for full-length JSRV21 and 1 μg of expression plasmids for oBST2B (2B) or oBST2B-HA (2B-HA) or an empty pcDNA3.1 control (−). Blots were incubated with the appropriate antisera as indicated in each panel. (B) Viral-particle release and Env incorporation in the presence of an increasing amount of oBST2B or oBST2B-HA (0.25 μg to 2 μg) were detected with an anti-Gag (CA) and anti-Env (SU) antibodies and quantified by chemifluorescence. (C and D) Values for CA and SU expression were related to values obtained for cells cotransfected with an expression plasmid for JSRV21 and the empty pcDNA3.1 plasmid (taken as 100). Blots represent the ratios of SU/CA expression calculated from three independent experiments. (C) A two-way statistical ANOVA shows that there is no difference in the relative SU/CA ratios between cells transfected with oBST2B- and oBST2B-HA-expressing plasmids (P = 0.74). (D) These ratios are negatively correlated with the quantity of transfected plasmids (P = 0.006). Open circles are ratio values; black circles (C) or horizontal bars (D) represent the mean ratios of the data obtained.
FIG 7
FIG 7
oBST2B reduces infectivity of MLV-based vectors pseudotyped by JSRV Env or VSV-G glycoproteins. (A) Representative Western blots of cellular extracts (lysates) of CPT-Tert transfected with 1 μg of the expression plasmid for oBST2B-HA [CPT (1 μg)] or 293T cells stably expressing oBST2B-HA (293T/B-HA). oBST2B-HA was detected using an anti-HA antibody. α-Tubulin (α-Tub) was used as a sample-loading control. (B) 293T/B-HA cells were analyzed by confocal microscopy using antibodies to the HA epitope and cadherins, as indicated in the panel. The scale bar represents 10 μm. (C) Western blots of concentrated viral particles recovered from the supernatants of 293T or 293T/B-HA cells (indicated by a minus or a plus sign, respectively) transfected with the expression plasmids in the amounts (5 μg, 2 μg, or 0.8 μg) reported above the blots. Blots were incubated with anti-MLV-CA and anti-JSRV-SU or anti-VSV-G antibodies, as indicated. Each experiment was repeated independently three times, and representative Western blots are shown. Viral-particle release and Env incorporation of JSRVpp-2 μg and JSRVpp-0.8 μg produced in 293T and 293T/B-HA cells were assessed by chemifluorescence. Values for CA and SU expression in 293T/B-HA cells were related to values obtained in 293T control cells (arbitrarily set as 100%). The graph represents the SU/CA ratios of JSRVpp-2 μg and JSRVpp-0.8 μg produced in 293T/B-HA cells. Note that there is a statistically significant difference (P = 0.01, calculated by one-way ANOVA) in 293T/B-HA cells that depends on the amount of JSRV Env expression plasmid transfected. Open circles indicate ratio values, while black horizontal bars represent the mean ratio values of the data obtained. (D) NoEnvpp-, JSRVpp-, and VSVpp-infected CPT-Tert cells were analyzed by fluorescence-activated cell sorter (FACS) at 72 h postinfection to quantify the percentage of GFP-positive cells. The percentage of cells infected with JSRVpp and VSVpp produced in control 293T cells was designated 100% of infectivity. Experiments were performed independently at least three times with two biological replicates for each CPT-Tert infection. Bars indicate standard errors.

Similar articles

Cited by

References

    1. Van Damme N, Goff D, Katsura C, Jorgenson RL, Mitchell R, Johnson MC, Stephens EB, Guatelli J. 2008. The interferon-induced protein BST-2 restricts HIV-1 release and is downregulated from the cell surface by the viral Vpu protein. Cell Host Microbe 3:245–252. doi:10.1016/j.chom.2008.03.001. - DOI - PMC - PubMed
    1. Neil SJ, Zang T, Bieniasz PD. 2008. Tetherin inhibits retrovirus release and is antagonized by HIV-1 Vpu. Nature 451:425–430. doi:10.1038/nature06553. - DOI - PubMed
    1. Neil SJ. 2013. The antiviral activities of tetherin. Curr Top Microbiol Immunol 371:67–104. doi:10.1007/978-3-642-37765-5_3. - DOI - PubMed
    1. Weinelt J, Neil SJ. 2014. Differential sensitivities of tetherin isoforms to counteraction by primate lentiviruses. J Virol 88:5845–5858. doi:10.1128/JVI.03818-13. - DOI - PMC - PubMed
    1. Perez-Caballero D, Zang T, Ebrahimi A, McNatt MW, Gregory DA, Johnson MC, Bieniasz PD. 2009. Tetherin inhibits HIV-1 release by directly tethering virions to cells. Cell 139:499–511. doi:10.1016/j.cell.2009.08.039. - DOI - PMC - PubMed

Publication types

MeSH terms

Substances

LinkOut - more resources