. 2015 Jan;89(1):552-67.
doi: 10.1128/JVI.02451-14. Epub 2014 Oct 22.

Uneven genetic robustness of HIV-1 integrase

Affiliations

Uneven genetic robustness of HIV-1 integrase

Suzannah J Rihn et al. J Virol. 2015 Jan.

Abstract

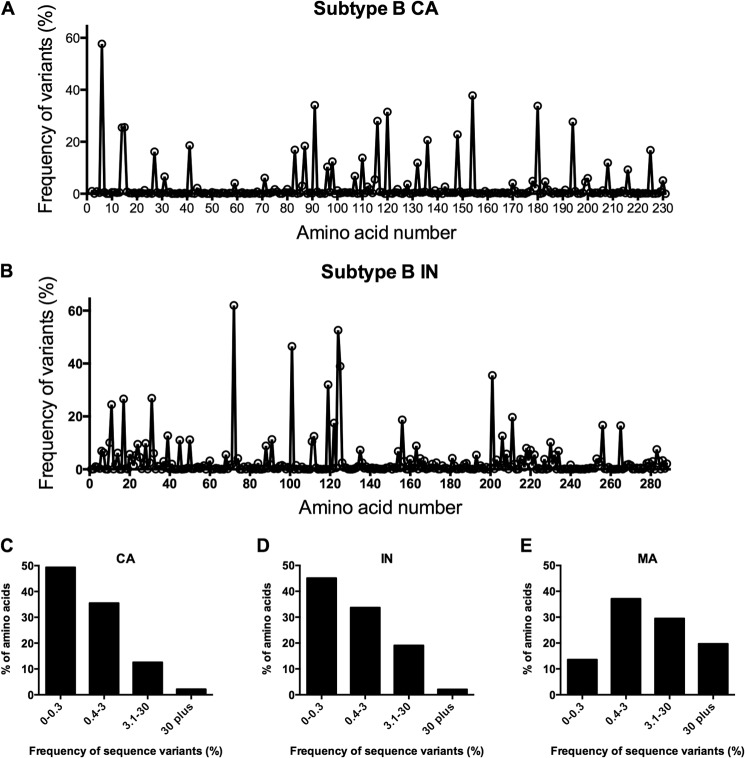
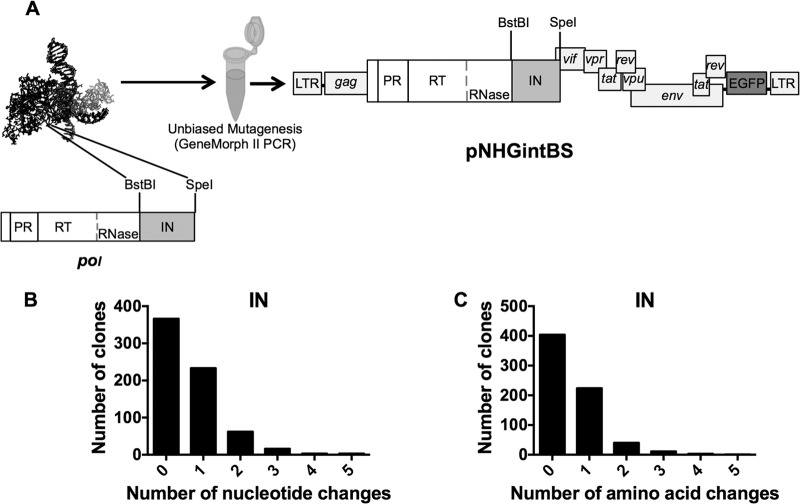
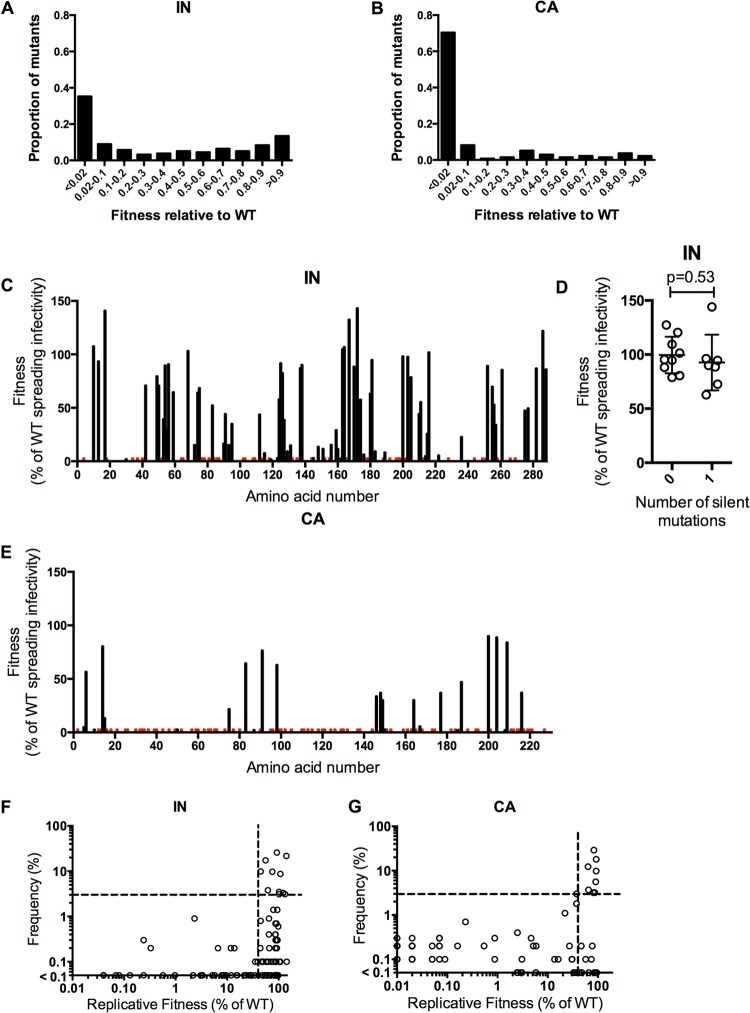
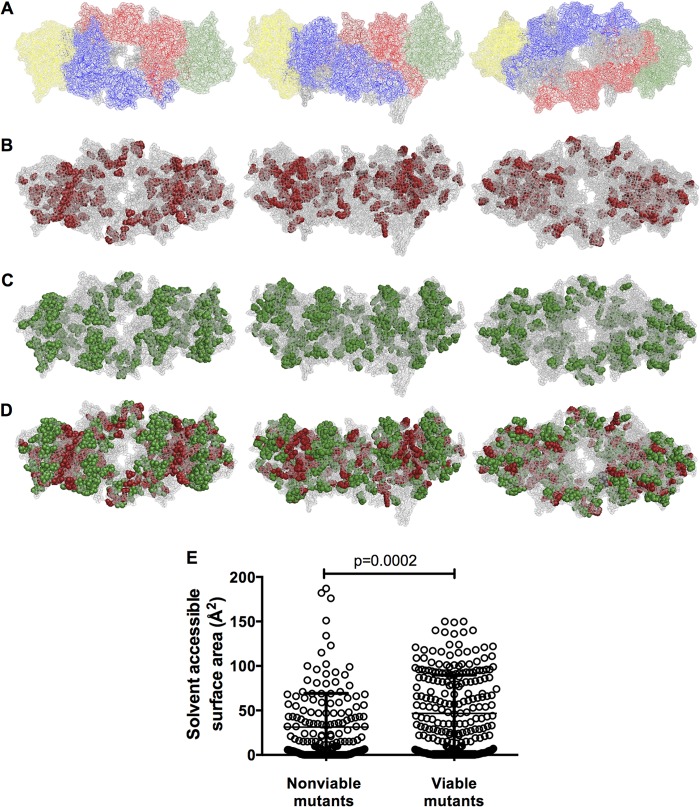
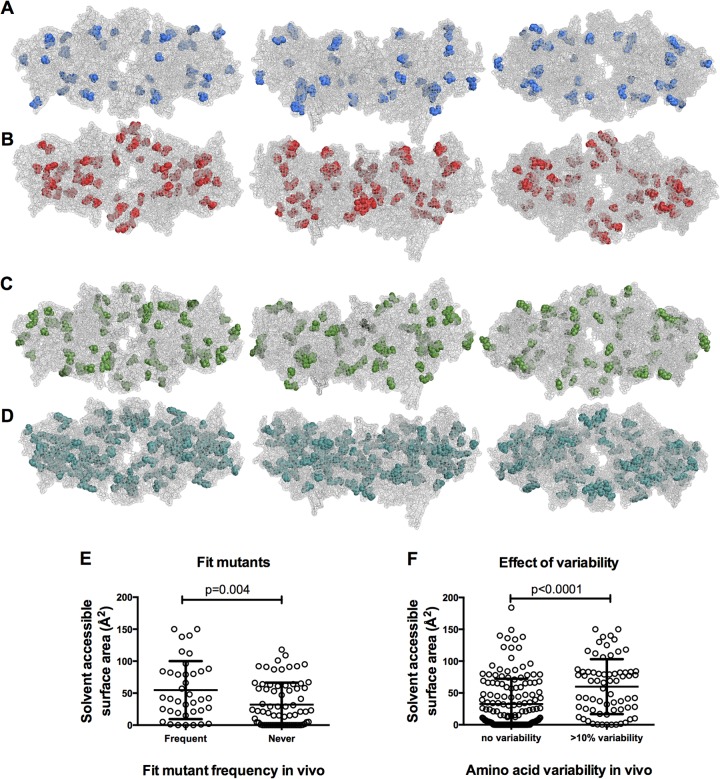
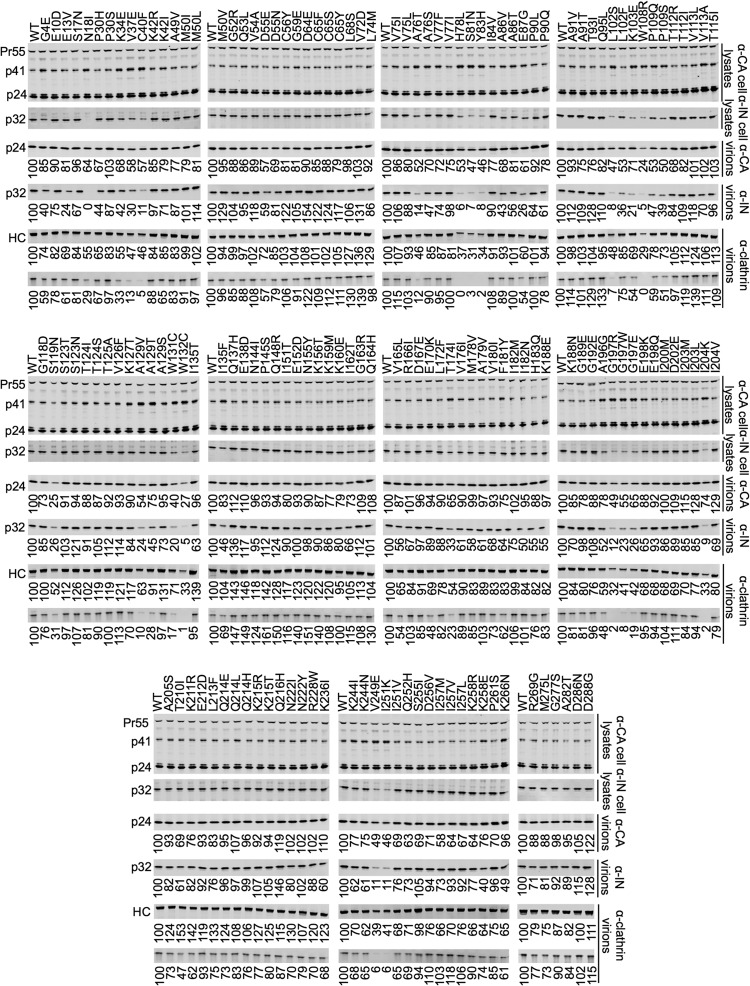
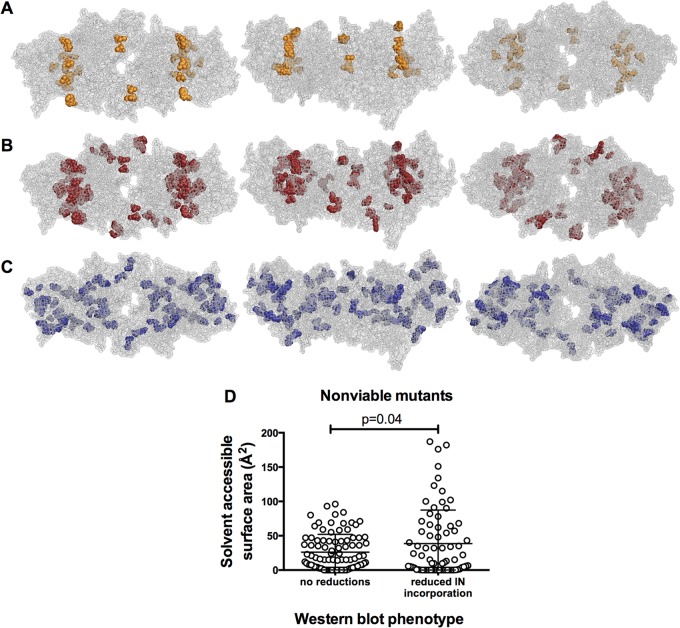
Genetic robustness (tolerance of mutation) may be a naturally selected property in some viruses, because it should enhance adaptability. Robustness should be especially beneficial to viruses like HIV-1 that exhibit high mutation rates and exist in immunologically hostile environments. Surprisingly, however, the HIV-1 capsid protein (CA) exhibits extreme fragility. To determine whether fragility is a general property of HIV-1 proteins, we created a large library of random, single-amino-acid mutants in HIV-1 integrase (IN), covering >40% of amino acid positions. Despite similar degrees of sequence variation in naturally occurring IN and CA sequences, we found that HIV-1 IN was significantly more robust than CA, with random nonsilent IN mutations only half as likely to cause lethal defects. Interestingly, IN and CA were similar in that a subset of mutations with high in vitro fitness were rare in natural populations. IN mutations of this type were more likely to occur in the buried interior of the modeled HIV-1 intasome, suggesting that even very subtle fitness effects suppress variation in natural HIV-1 populations. Lethal mutations, in particular those that perturbed particle production, proteolytic processing, and particle-associated IN levels, were strikingly localized at specific IN subunit interfaces. This observation strongly suggests that binding interactions between particular IN subunits regulate proteolysis during HIV-1 virion morphogenesis. Overall, use of the IN mutant library in conjunction with structural models demonstrates the overall robustness of IN and highlights particular regions of vulnerability that may be targeted in therapeutic interventions.

Importance: The HIV-1 integrase (IN) protein is responsible for the integration of the viral genome into the host cell chromosome. To measure the capacity of IN to maintain function in the face of mutation, and to probe structure/function relationships, we created a library of random single-amino-acid IN mutations that could mimic the types of mutations that naturally occur during HIV-1 infection. Previously, we measured the robustness of HIV-1 capsid in this manner and determined that it is extremely intolerant of mutation. In contrast to CA, HIV-1 IN proved relatively robust, with far fewer mutations causing lethal defects. However, when we subsequently mapped the lethal mutations onto a model of the structure of the multisubunit IN-viral DNA complex, we found the lethal mutations that caused virus morphogenesis defects tended to be highly localized at subunit interfaces. This discovery of vulnerable regions of HIV-1 IN could inform development of novel therapeutics.


Figures

FIG 1
FIG 1
Naturally occurring variation in HIV-1 IN and CA. (A, B) Depictions of the frequency (%) of variants from WT that occur at each amino acid in 1,000 HIV-1 subtype B CA (A) or IN (B) sequences. Amino acid position is plotted on the x axis from left (N terminus) to right (C terminus). (C, D, E) A different representation of sequence variation wherein the y axis shows the percentage of amino acids within CA (C) or IN (D) or MA (E) with the indicated frequency (%) of variants on the x axis.
FIG 2
FIG 2
Production and characterization of the IN mutant library. (A) Schematic illustrating the PCR-based mutagenesis of the 864-bp HIV-1 IN coding sequence flanked by BstBI and SpeI restriction sites in the replication-competent proviral plasmid pNHGintBS. (B) Distribution of the number of nucleotide changes found in each clone in the IN library. Duplicate sequences, those that were represented more than once, are included. (C) Distribution of the number of amino acid changes found in each clone in the IN library. Clones containing duplicate mutations, nonsense mutations, or frameshift mutations are included.
FIG 3
FIG 3
Fitness of randomly introduced and naturally occurring IN and CA mutations. (A, B) Distribution of mutational fitness effects (DMFE) for the single-amino-acid IN (A) and CA (B) mutant libraries. (C, E) Plots of fitness measurements for individual IN mutants (C) and CA mutants (E). Fitness, as a percentage of WT in a replicative fitness assay, is plotted against the position of mutation organized on the x axis from left (N-terminal amino acid) to right (C-terminal amino acid). For amino acids with more than one unique mutation, the smallest fitness value is plotted. Red bars indicate the locations of nonviable mutants (<2% of WT fitness), while gaps indicate residues for which no mutant was present in the library. For IN mutants in panel C, this is a graphical representation of the results found in Tables 1 and 2. (D) Fitness measurements for IN library clones containing either 0 (WT, NHGintBS) or 1 noncoding nucleotide change. (F, G) Plots of the frequencies with which IN (F) and CA (G) mutations that were present in the random mutant libraries occur in 1,000 HIV-1 subtype B CA and IN sequences (y axis) versus the measured replicative fitness of viruses carrying the same mutations (x axis). A horizontal dashed line indicates a frequency of 3%, above which mutations were considered to occur frequently. A vertical dashed line indicates 40% of WT replicative fitness, below which mutants occurred rarely in natural populations (frequency of <1%). Mutants with fitness below 0.01% of WT fitness, and that were not observed in nature, would appear on the origin of the graph and are not plotted.
FIG 4
FIG 4
Viable and nonviable HIV-1 IN mutants displayed in the context of an intasome model. (A) Images of an HIV-1 intasome model (28), in which the individual IN subunits of the tetramer are shown in different colors. Inner subunits are shown in blue and red, while outer subunits are in green and yellow. Outer subunits include the CCD only, while inner subunits include full-length IN. DNA is shown in gray, and magnesium and zinc binding pockets are not visible. The image on the left displays the intasome from the (arbitrarily defined) top, the center image displays a side profile image, and the image on the right displays a view of the intasome from below. This model, and image arrangements, is used for all subsequent displays of the intasome. (B) Locations of nonviable (<2% WT replicative fitness) IN mutants displayed in red on the intasome model. Image views are as described for panel A. (C) Locations of viable (>2% WT replicative fitness) IN mutants displayed in green on the intasome model. (D) Locations of both nonviable (red) and viable (green) IN mutants on the same intasome model. (E) Correlation of mutant viability with amino acid surface exposure as measured by solvent-accessible surface area (in Å2). Mutated IN residues were designated either viable or nonviable based on the 2% replicative fitness cutoff, and solvent-accessible surface area values for each mutated residue in each IN subunit were plotted, in order to represent the various degrees of surface exposure for the same residue in different subunits (as available).
FIG 5
FIG 5
Naturally occurring IN variability displayed on the intasome model. (A) IN mutants that were fit (>40% of WT replicative fitness) and occurred frequently (>3% of 1,000 HIV-1 subtype B IN sequences) are displayed in blue on an intasome model. (B) IN mutants that were fit (>40% of WT replicative fitness) but never occurred in 1,000 HIV-1 subtype B IN sequences are displayed in red on an intasome model. (C) IN amino acids that were variable from WT in >10% of 1,000 HIV-1 subtype B IN sequences are displayed in green on an intasome model. (D) IN amino acids for which there was no variation in 1,000 HIV-1 subtype B IN sequences are displayed in teal on an intasome model. (E) Comparison of solvent-accessible surface area values for fit (>40% of WT) IN mutants that occurred frequently (>3%) or never occurred in 1,000 subtype B IN sequences. All available subunit solvent-accessible surface area values were plotted for each amino acid. (F) Comparison of solvent-accessible surface area for IN amino acids that were variable in >10%, or invariant, in 1,000 HIV-1 subtype B IN sequences. All available subunit solvent-accessible surface area values were plotted for each amino acid.
FIG 6
FIG 6
Phenotypic characterization of IN mutants. Western blot analyses, using anti-CA, anti-IN, and anti-clathrin heavy chain antibodies, of virions and cell lysates generated using 293T cells transfected with the IN mutant proviral plasmids. The numbers shown below lanes indicate the fluorescence intensities (LiCOR) associated with the CA, IN, or clathrin HC protein that was pelleted from virion-containing supernatant. The blots shown below the anti-clathrin heavy chain (HC) blots are a secondary clathrin band appearing on the same blot that is assumed to be a product of digestion by HIV-1 protease in virions. Mutants were considered phenotypically different to WT if CA or IN protein levels were decreased by at least 2-fold.
FIG 7
FIG 7
HIV-1 IN mutants affecting particle production and IN levels displayed in the context of an intasome model. (A) Nonviable IN mutants conferring at least a 2-fold reduction in particle production, displayed on an intasome model; (B) nonviable IN mutants conferring at least a 2-fold reduction in virion-associated IN levels, displayed on an intasome model; (C) nonviable IN mutants conferring no significant reductions in either particle production or virion-associated IN levels, displayed on an intasome model. These mutants exhibited a loss of virion infectiousness only. (D) Solvent-accessible surface area (in Å2) for IN mutants that either did or did not cause a 2-fold reduction in virion-associated IN protein levels. All available subunit solvent-accessible surface area values were plotted for each amino acid.

Similar articles

Cited by

References

    1. Holland J, Spindler K, Horodyski F, Grabau E, Nichol S, VandePol S. 1982. Rapid evolution of RNA genomes. Science 215:1577–1585. doi:10.1126/science.7041255. - DOI - PubMed
    1. Sanjuan R, Nebot MR, Chirico N, Mansky LM, Belshaw R. 2010. Viral mutation rates. J Virol 84:9733–9748. doi:10.1128/JVI.00694-10. - DOI - PMC - PubMed
    1. Elena SF. 2012. RNA virus genetic robustness: possible causes and some consequences. Curr Opin Virol 2:525–530. doi:10.1016/j.coviro.2012.06.008. - DOI - PubMed
    1. de Visser JA, Hermisson J, Wagner GP, Ancel Meyers L, Bagheri-Chaichian H, Blanchard JL, Chao L, Cheverud JM, Elena SF, Fontana W, Gibson G, Hansen TF, Krakauer D, Lewontin RC, Ofria C, Rice SH, von Dassow G, Wagner A, Whitlock MC. 2003. Perspective: evolution and detection of genetic robustness. Evolution 57:1959–1972. doi:10.1111/j.0014-3820.2003.tb00377.x. - DOI - PubMed
    1. Lauring AS, Frydman J, Andino R. 2013. The role of mutational robustness in RNA virus evolution. Nat Rev Microbiol 11:327–336. doi:10.1038/nrmicro3003. - DOI - PMC - PubMed

Publication types

Substances

LinkOut - more resources